25 Resource Management KPIs to Track in 2025
25 Resource Management KPIs to Track in 2025

The professional services industry is projected to surpass USD 10.17 trillion by 2031, and services firms must wisely invest in resources to thrive. However, many struggle to manage these resources effectively. How can we measure this? Start mastering resource management KPIs. Tracking resource management KPIs is crucial for sustained growth and profitability. It is also how you track progress.
Common resource management challenges can quickly accumulate, such as inadequate strategic planning, staff misallocation, and revealing burdened teams. Uncontrolled overtime expenses and last-minute resource needs can push projects over budget.

This results in poor project management and service delivery. This also impacts the customer experience. Resource management is more than just looking to streamline processes.
This post will explore essential resource management KPIs (aka key performance indicators) that professional services firms should track and how to leverage them to improve operations and the resource management process.
While this article is meant for professional services leaders and professionals, the advice may be useful for resource and project managers looking to drive project success. Addressing these resource management metrics head-on can boost productivity and keep your team on track.
Objective data can also help you maintain a competitive edge in this rapidly expanding industry. After all, how do you know your resource management strategy is working without proper measurement or regular tracking?
At the end of the day, resource management KPIs will help you gain valuable insights to improve your resource management strategy and ensure informed decision-making for business operations to maximize revenue. So, what are the relevant metrics or key performance indicators? What does each metric measure? Let’s dive into it, shall we?
Why Resource Management KPIs Matter
Before diving into specific KPIs, it’s important to understand why measuring resource management effectiveness is so critical. Resource management KPIs provide valuable insights into:
- Efficiency: Are resources being used well, or are there areas of waste?
- Productivity: How effectively are team members using their time and skills? What was the project performance like?
- Profitability: Are projects delivering the expected returns, and are resource costs or planned costs under control? What are the actual costs? Budgeted costs? Actual hours worked? Actual revenue? Actual utilization rate?
- Project Health: Are projects in your project portfolio on schedule and within budget? What’s the project’s progress?
- Employee Satisfaction: Are workloads balanced, and are employees feeling supported and challenged?
- Forecasting: What is your forecasted utilization? How can we achieve better resource efficiency in the future based on predictive analytics?

By monitoring these quantifiable metrics, firms can identify bottlenecks, improve resource allocation, and make data-driven decisions based on data-driven insights that improve overall performance. This is a comprehensive overview.
As McKinsey found, 83% of executives believe allocating resources is key to reaching their goals. Reallocating resources also increases company value and can be incredibly rewarding.

Why Do Resource Management, Project Management, and Human Resource Management (HRM) Have Similar KPIs?
Resource management involves:
- Project management
- Human resources
- Resource utilization
- Resource availability
- Resource scheduling
- Resource capacity utilization
- Budget and expenses
- Billable utilization
… and more! Hence, the metrics we explore may be similar to those of project and human resource management.
Resource management, project management, and human resource management (HRM) often share similar KPIs because they are interconnected. They support each other in achieving organizational goals. Resource management includes human resources and project management as part of its broader scope.
Resource management ensures the productive use of all business resources, including human resources, assets, facilities, and equipment. While human resources and project management are both resource management components, their focus and responsibilities differ significantly. Its focus is on optimizing the use of all resources across the organization for efficiency and effectiveness. This includes ensuring resource billability and coordinating with various departments to meet project needs.
On the other hand, human resource management focuses on managing an organization’s human capital. It involves recruitment, training, performance management, and employee relations to align the workforce with the organization’s strategic goals. Meanwhile, project management aims to deliver projects on time, within budget, and to the required quality standards.
While there is overlap in roles and responsibilities, they’re very different. Resource managers coordinate resource allocation, work with project managers to understand resource needs, and collaborate with HR to address resource gaps. However, HR managers oversee hiring, talent development, employee benefits, conflict resolution, and labor law compliance to create a productive work environment. They align the workforce with organizational objectives. Lastly, project managers strive to deliver projects on time within any organization.

To sum it up, all three disciplines have the common goal of aligning with organizational strategic objectives. For instance, HRM’s focus on employee engagement and development supports resource management’s goal of optimizing resource utilization and project management’s need for skilled teams to deliver projects successfully.
In practice, roles often overlap. For example, project managers may influence resource allocation decisions, while HRM supports both by managing talent pipelines and ensuring compliance with organizational policies. The similarity in KPIs across these fields reflects their shared objectives of optimizing efficiency, productivity, and strategic alignment within an organization.
Key resource management KPIs to track
Here are some of the most important resource management KPIs and industry benchmarks for professional services leaders:
1. Resource utilization rate
This is the percentage of time that resources (people, equipment, etc.) are actively working on billable projects. This is also known as the billable utilization rate.

A high utilization rate or billable utilization indicates efficient resource allocation. However, it’s essential to avoid overutilization. This can lead to burnout and decreased quality. Aim for a balanced utilization rate that maximizes productivity without compromising employee well-being.
A good target to aim for is 80%. This considers holidays, training, personal time off, and other employee breaks from work. However, this target will vary based on the company, role, and expectations.
2. Resource capacity utilization
Resource capacity utilization measures how much of your capacity is used compared to its total potential. It could also just measure how many work hours are occupied by projects or tasks. This helps you allocate your resources well. Depending on your goal, here are two formulas (and two calculations; their outputs don’t feed into one another).
For resource capacity utilization across your organization:

To calculate resource capacity utilization on a project-by-project basis:

3. Project profit margin
Project profit margin is the difference between project revenue and project costs, expressed as a percentage.

This KPI directly reflects the financial success of client projects. Monitoring project profit margins helps identify underperforming projects and areas where costs can be managed appropriately.
This target varies widely from industry to industry, from 10% to 70%. It is important to keep track of your company’s history.
4. Billable hours vs. non-billable hours
This ratio measures the hours spent on client projects that can be invoiced versus hours spent on administrative or overhead tasks not directly billable to clients.

This directly impacts revenue and profitability. High billable hours indicate efficient resource utilization or billable utilization.
5. Budget variance
Budget variance is the difference between the planned project budget and the actual project cost.
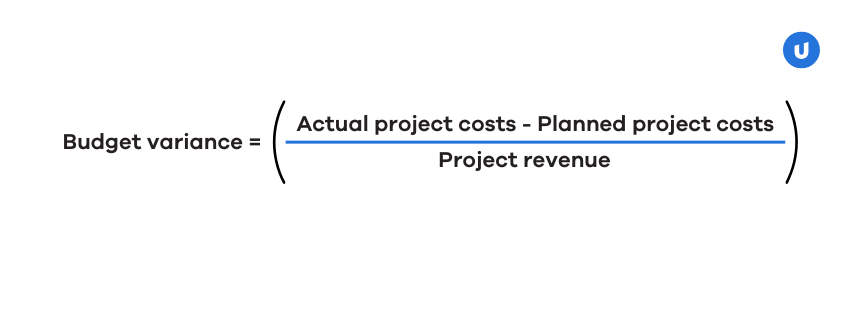
Budget variance helps track cost overruns and identify areas where project budgets are inaccurate or unrealistic. Ideally, you want to keep this as close to 0% as possible. A common ground is 5% to 10%.
6. Schedule variance
Schedule variance is the difference between the planned project timeline and the actual project duration.
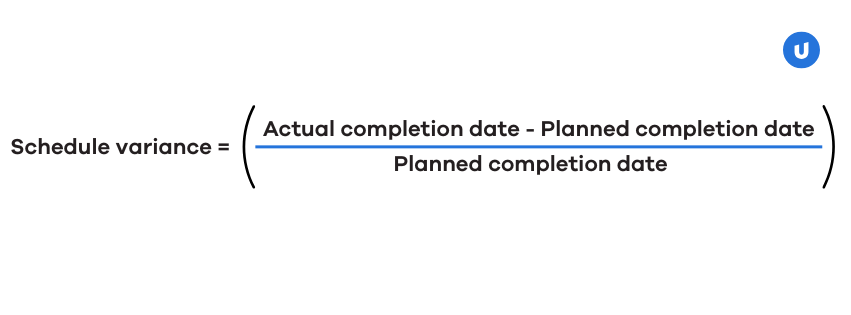
Schedule variance highlights project delays and helps identify factors contributing to missed deadlines. Similar to Budget Variance, you would like this to be as close to 0% as possible, and maintaining under a 5% to 10% difference is a good target.
7. Resource cost variance
Resource cost variance is the difference between actual and budgeted costs for resources.

Knowing this helps manage project budgets and resource costs. You should minimize variance to stay within budget as much as possible.
8. Resource effort variance
This calculation is slightly different. Resource effort variance looks at the difference between forecasted and actual hours worked instead of actual and budgeted costs.

Tracking this helps improve forecasting accuracy and resource planning. Similar to resource cost variance, you should minimize variance to optimize resource allocation.
9. Project completion rate
This is the percentage of projects completed on time and within budget.

A low completion rate may indicate issues with project planning, project tasks, resource allocation, or execution.
10. Cost of managing processes
This is the cost associated with managing resource management processes.
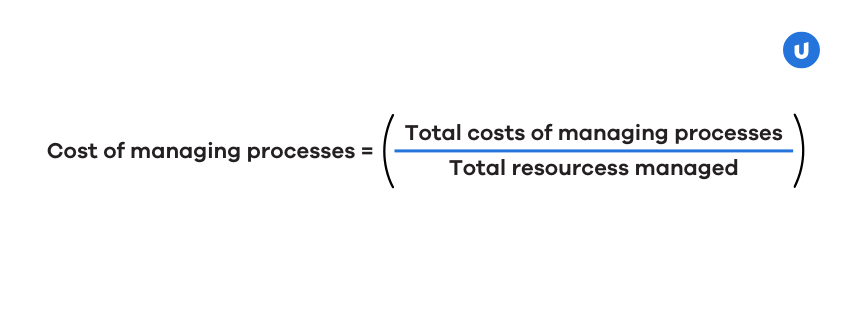
This helps identify areas for cost reduction and better resource allocation efficiency. The goal is to minimize unnecessary costs while maintaining productive management.
11. Planned value (PV)
Planned value is the budgeted cost of work scheduled.

It tracks project budget adherence and resource allocation. In resource management, the aim is to align actual costs with planned value.
12. Planned time vs. used time
This ratio compares planned project timelines with the actual time used.

You become aware of the hours spent on project scheduling and resource allocation when you track this. Your goal should be to align actual time with planned time for efficient project execution.
13. Gross profit margin
This measures the profitability of projects after deducting direct costs.

Get more insights into project profitability and resource effectiveness. The target is obvious… aim for a high gross profit margin to ensure business growth!
14. Percentage of projects completed on time
This is a little different from the project completion rate. It measures the proportion of projects completed within scheduled timelines.

This KPI indicates project management efficiency and resource utilization. Aim for a high percentage to ensure timely project delivery.
15. Average cost per hour
The average cost of labor per hour helps evaluate resource cost efficiency.

The goal here is to optimize costs while maintaining quality and productivity
16. Employee satisfaction score
This measures employee morale and job satisfaction, often collected through surveys or feedback sessions.
Formula: Varies, based on the type of surveys used.
Employee satisfaction is linked to increased productivity, reduced turnover, and improved client service. Monitor this KPI to ensure workloads are balanced and employees feel valued.
17. Turnover rate
This is the total rate of employees leaving the organization, forced and voluntary. Some may refer to this as the resource turnover rate.

High turnover can indicate management issues or a poor work environment. Aim for a low turnover rate to maintain team stability.
18. Time to hire
Time to hire is the time it takes to fill an open position.
Formula: Average time from job posting to hiring.
This affects project timelines and resource availability. The desirable target is to minimize hiring time while ensuring quality candidates.
19. Ramp speed
Ramp speed is the time it takes for new employees to reach full productivity.
Formula: Average time from hiring to achieving the desired utilization rate.
This impacts project efficiency and resource utilization. The lower the ramp time (the hours spent), the better. To reduce ramp time and optimize training processes (and training costs).
20. Revenue per employee
This is precisely what it says it is: the revenue generated per employee. You can also alter this to revenue per resource (an employee is a resource).

Revenue per employee measures organizational efficiency and resource productivity. Aim for high revenue per employee to indicate effective resource use.
21. Average performance rating
This is the average performance score of employees.
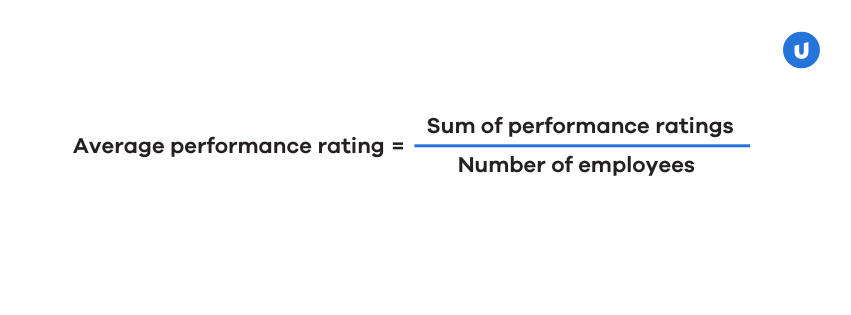
It indicates the effectiveness of performance management. High average ratings mean high-quality performance. Aim high here.
22. Employee engagement
This measures how engaged employees are at work and with their work. Employee engagement impacts productivity and job satisfaction. Like the employee satisfaction core, surveys or feedback sessions often collect this.
Formula: Surveys or engagement metrics from an employee engagement platform.
General rule of thumb? Maintain high engagement levels for better outcomes.
23. Employee productivity rate
This rate measures an employee’s output or value relative to their input (time, effort).

This will provide insight into individual performance and help identify skill development or process improvement areas.
24. Return on Investment (ROI)
This is similar to project profit margin but measures the overall profitability of all projects by comparing costs to returns.

ROI helps evaluate project viability and resource allocation effectiveness. Aim for a positive ROI to ensure project profitability.
25. Forecast Accuracy
This is one way to calculate how resource forecasts match actual resource needs. Visualization tools may help, too. You can leverage technology to ensure these forecasts are accurate.

Accurate forecasting is essential for avoiding resource shortages and last-minute scrambles. Automatically forecasting skills gaps will help plan and get people with the right skills on the right projects.
Overcoming resource management challenges by tracking KPIs
Many professional services firms face common resource management challenges that hinder their ability to track and improve these KPIs effectively. These include:
- Lack of clear resource requirements: Many firms struggle to define their resource needs, which leads to wasted time and effort.
- Inefficient resource allocation: Misallocation of resources, where some employees are overloaded while others have downtime, is a common problem. McKinsey found that 83% of executives believe allocating resources is key to reaching their goals.
- Skipping a resource management plan: A solid plan is essential for project success. Agency leaders want to hire talent but struggle with resource planning.
- Getting resource forecasting wrong: Inaccurate forecasting can lead to resource shortages and increased costs. The RMI discovered that 88% of resource management issues stem from poor forecasting.
- Lack of visibility across projects: When teams work in silos, misunderstandings and bottlenecks can occur.
How Upland PSA Can Help
Upland PSA offers a comprehensive solution to these challenges by providing a centralized resource planning, tracking, and forecasting platform. With Upland PSA, you can:
- Clearly define resource requirements: Outline and document resource needs to meet project demands.
- Improve resource allocation: Match the right people with the right skills to the right tasks.
- Create and manage a resource management plan: Keep your team organized and focused on achieving results.
- Accurately forecast resource needs: Analyze historical data and current workloads to understand future resource demands.
- Gain visibility across projects: Track resource allocation and workload across all projects in one place.
- Track resource performance metrics: Upland PSA provides clear KPIs to help you track resource performance
By automating these tasks and providing real-time insights, Upland PSA helps professional services firms optimize resource utilization, improve project profitability, and improve overall efficiency.
Make Every Resource Count with Upland PSA
Effective resource management KPIs are essential for professional services firms looking to thrive. You can improve resource allocation and project outcomes. Drive sustainable growth by tracking the right metrics and leveraging a powerful PSA solution like Upland PSA.
Are you ready to manage your resources today? Catch Upland PSA in action.