All B2B marketers know (and love) that content marketing has become the new cool kid in town. Content Marketing Institute found that 70% of B2B enterprises are creating more content than a year ago, with 52% planning to increase spending on content.
The need for content among B2B buyers is in high demand, and marketers have to step up to the plate.
But one might ask—is content simply a marketing fad? Absolutely not. In fact, 60% of people are inspired to seek out a product after reading content about it, and 77% of buyers want different content at each stage of the research process.
But amid all the glitz and glamour (and revenue) that content brings to your business, there is a glaring obstacle facing B2B marketers. In business pioneer John Wanamaker’s words, “Half the money I spend on advertising is wasted; the trouble is, I don’t know which half.”
The same holds true in B2B marketing.
Like many other B2B marketers, you’re probably pumping out content like it’s your job (see what I did there?), but when the time comes to see which content is most valuable to your customers, you’re likely drawing a blank.
You know your content is bringing in leads and closing deals, but you’re still scrambling to scrape together loose metrics to report your success.
Believe me, you aren’t alone. Fifty percent of B2B enterprise marketers cite the inability to measure content effectiveness as a challenge.
Below are three key areas that your metrics should focus on. Implement them into your reporting structure today to see the true value of your external and internal content.
1. The Health of Your Content Production Cycle
If your content production activities are primarily spent sifting through emails and attachments to get a single asset out the door, join the club.
Unfortunately, these inefficiencies cut deeply into your time, productivity, and, ultimately, your budget. A Gleanster report found that inefficiencies in content production process are costing mid-size to large companies a whopping $958 million a year.
To improve the health and efficiency of your content production cycle, here are some key metrics to start tracking right away.
Average Length of Production
Track the start and finish dates for various content types to start forming a baseline for overall content timelines.
Delivery Rates
Track which pieces of content are delivered on time, and which pieces are continually overdue. This will help you begin to track bottlenecks in your workflows. Are specific team members holding up the process? Is a tool not being used appropriately? This metric helps you dig deeper into your productivity bottlenecks to begin addressing them, rather than wondering why your whitepapers are always held up in production.
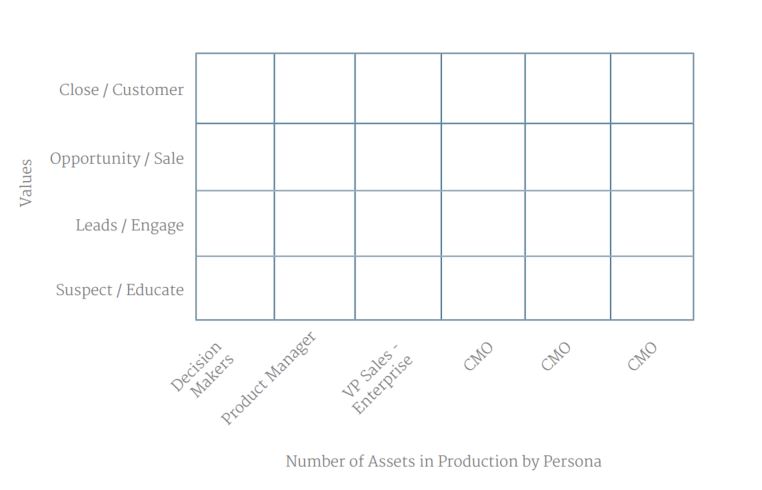
Content Coverage Gaps
By aligning content to the buyer’s journey (as well as other key objectives like regions and business units), you can locate gaps in coverage and address them strategically. By not tracking this metric, you risk relying on guesswork—rather than actual data—to fill important gaps. Use the graph below as a template!
2. Your Content’s Reach (Internal and External)
External
Every modern B2B marketer knows how important it is to prove that your efforts are driving revenue. We also know that it’s easier said than done.
In a Demand Metric study, 17% of marketers said they have no content effectiveness measurements in place, and 49% are using only basic metrics such as clicks or downloads.
Clicks and downloads tell us about engagement, but they don’t give us insight that ties back to revenue. To know the true value of your content, you need more meaningful analytics than engagement alone.
You need data that shows you what channels and content types more effectively drive leads deeper into the buyer’s journey.
Stop wasting time developing irrelevant content for content’s sake. Here are some key metrics to start tracking beyond clicks so you can measure the true ROI your content.
To measure cross-channel reach:
- # Engagements per month by type of engagement (views, downloads, opens, etc.)
- Traffic by channel category (direct, paid, organic, etc.)
- Referral percentage by channel source
Engagement by category:
- # Engagements by content type
- # Engagements by sales stages
- # Engagements by buyer persona
Top engaged assets:
- 10 most engaged with assets per quarter
- 10 most shared assets per quarter
Internal
Have you ever poured loads of time, energy, and creative bandwidth into a shining, glorious piece of content, only to hear a month later that the sales team never used it?
If not, let me tell you, it’s a real bummer.
Internal reach metrics are often overlooked in the B2B space, but it’s critical to know how your internal teams are using your content, if at all.
Only 27% of B2B marketers track content utilization metrics, resulting in lots of wasted effort. In fact, as much as 70% of B2B marketing content is never used by sales teams.
That, my fellow marketers, is an even bigger bummer.
But fear not, there are some key internal metrics you can begin tracking right away to start measuring the value of your content.
Internal Consumption
- # Month over month (MoM) internal views of assets
- # MoM internal downloads of assets
Internal Shares
- # MoM internal shares of assets via email or social
Referrals Earned
- # MoM referral traffic from internal shares
3. Your Content’s ROI (via Your Content Scoring Strategy)
Content scoring is another one of those buzzwords in the marketing arena these days. The truth is, 77% of buyers want different content at each stage of the product research process.
Content scoring measures your content’s effectiveness in driving conversions at each stage of your buyer’s journey, and assigns it a value. It’s a big deal.
But how do you integrate content scoring into your workflow in a way that will deliver value to your team and prove your content ROI?
An entire book could be written on this topic alone, but here are a few things to consider when setting up your content scoring strategy.
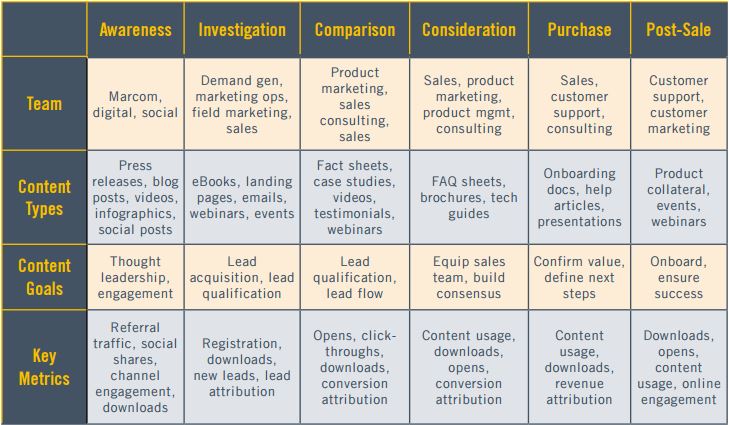
Clearly Define and Get Cross-Team Alignment on the Buyer’s Journey
If you don’t have a clearly defined buyer’s journey across your sales, marketing, and customer success teams, you run the risk of experiencing miscommunication, misalignment on messaging, and general chaos.
Once you have a clear buyer’s journey defined, map out associated content types associated with each stage. Below is an example chart from our latest eBook for reference.
Assign Scores to Key Content Types
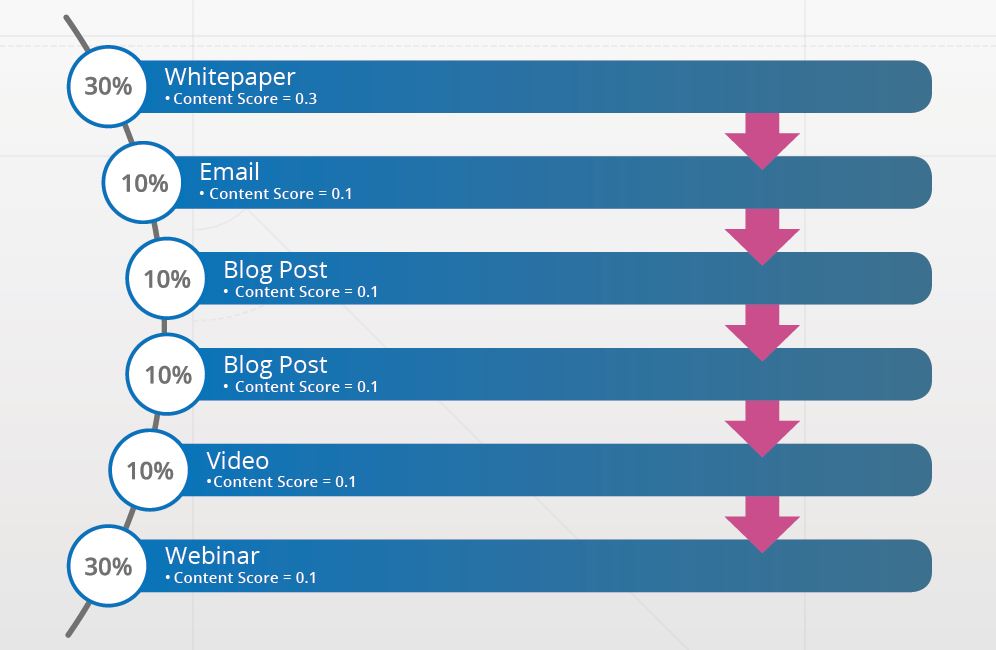
At Kapost, we use the first touch/last touch model. This means that for each stage of the defined buyer’s journey, whatever content was touched first and last within a stage gets a higher content score (let’s say, 0.33), and the remaining assets that were touched in between are evenly distributed until the value is 1.0 for a single lead.
Now imagine that hundreds of people are interacting with your content and moving from stage to stage. You’ll begin to see trends in which content types and themes are most effectively moving people down the pipeline.
Below is a chart explaining the first touch/last touch concept.
These content metrics are just the tip of the iceberg when it comes to measuring the true value of your content, but they should help you get started. Good luck, fellow marketers!