Have you recently looked at your active mobile marketing campaigns and asked: Which of these campaigns are actually moving the needle? This is an important question that can’t be answered with vanity metrics alone.
In mobile marketing, vanity metrics are click rates and conversion rates specific to individual campaigns. They’re short-term measures of success that can’t show you whether campaigns are increasing retention, engagement, and revenue.
The only way you can see all this is with lift analysis.
What is lift analysis?
Lift analysis is a way to measure how a campaign impacts a key metric. In mobile marketing, you could measure lift in engagement, in-app spend, or conversion frequency. Lift is calculated as the percent increase or decrease in each metric for users who received a new campaign versus a control group.
When a control group is enabled, you can see the “lift” in key metrics and make solid app marketing decisions.
How to use lift analysis
If done right, push notifications and in-app messages are successful channels for driving app growth. But not all strategies are created equal.
In our research, we discovered that some campaigns actually decrease engagement and conversions. Lift analysis helps marketers quit the bad campaigns and further optimize the good ones. Also, using a control group to calculate lift is the only way to truly gauge impact.
For short-term impact
Suppose you have an ecommerce app and run a push notification campaign to offer users 20% off. The control group doesn’t receive the 20% off promo and, because you’re a marketer who experiments, you A/B test the 20% off promo with two different notifications.
Variant A
FLASH SALE: All our cozy wintertime sweaters are 20% off with code SHOP20. Get the perfect present or the perfect look . Shop now.
Variant B
TODAY ONLY: Grab all of our bestselling accessories for 20% off with code MERRY20. Hurry, before everyone else does! Come on, treat yourself.

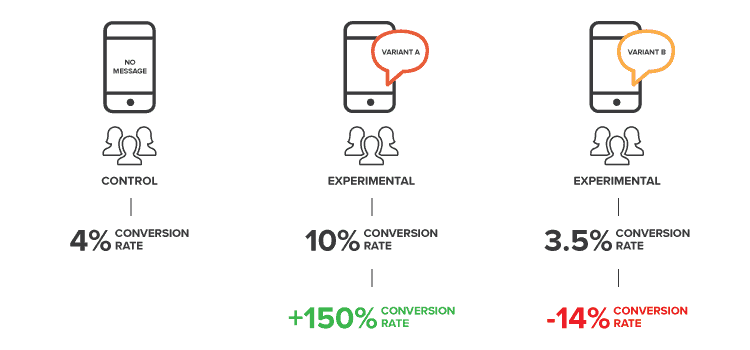
In this example, users who receive no promotional notification convert at a rate of 4%. This gives you a baseline for measuring the impact of your discount campaign.
After the campaign runs, you see Variant A drives a 10% conversion rate, enabling you to calculate a lift of 150% over the control group. It’s clear that Variant A has a positive impact on conversion.
On the other hand, Variant B has a 3.5% conversion rate, representing 14% less conversions than the control group. Variant B actually has a negative impact on conversions.
In this situation, the smart marketer would continue running Variant A and cut Variant B for the push notification campaign.
For long-term impact
Suppose you own a media app and run an in-app messaging campaign to offer users a free 7-day trial of your premium version. You currently have a control group in place not receiving the free trial offer. And again, because you believe in experimentation, you A/B test two in-app messages for the new campagin.
Variant A
Listen offline. Skip ads. And get unlimited songs. Click here to try our premium version FOR FREE for one week. No credit card required – just a body that’s ready to boogie. Try Now.
Variant B
Special Offer: FREE 7-day trial of our premium version! Click here upgrade your music experience and take your tunes anywhere. No strings attached – only unlimited songs await.

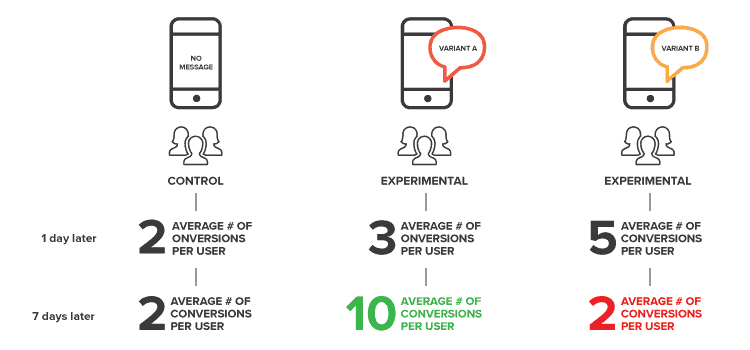
In this example, a key conversion event is “listened to a song.” And as you can see, the early results show that users who received Variant B listened to more songs one day later (150% lift over control). But this spike tapers off and the average number of conversions per user returns to the baseline level.
However, if you expand your time frame and look at the long-term effects of each campaign, users who received Variant A actually listened to more songs over the course of the 7-day free trial (400% lift over control).
In this situation, the smart marketer would continue running Variant A and cut Variant B for the in-app messaging campaign.
Look further ahead
The key takeaway here is to look beyond the immediate impact of your mobile messaging campaigns. Instead, look at which campaign shows the highest lift in important metrics over time. Lift analysis lets you do this and quantify the true impact of push notification and in-app messaging campaigns.
