Media & Entertainment App Benchmarks H2 2018
Media & Entertainment App Benchmarks H2 2018
Benchmarks for Media & Entertainment apps for H2 2018.
Wondering how your app is performing against others in your industry? Look no further! In this cheat sheet, we’ve provided benchmarks for Media & Entertainment apps based on our database of more than 37,000 apps. We’ve focused on benchmark data around several key metrics — app engagement, user retention and the impact of a mobile marketing strategy. The data is based on app usage for the second half of 2018.
Monthly App Engagement:
|
App Launches |
Session Length |
Time In App |
|
Average number of times an individual app is launched per month. |
Average time spent in an individual app across all sessions per month. |
Total amount of time spent in apps throughout the month. |
|
16.2 launches per month |
7 minutes, 14 seconds per month |
1 hour, 57 minutes per month |
Weekly App Engagement:
|
App Launches |
Session Length |
Time In App |
|
Average number of times an individual app is launched per week. |
Average time spent in an individual app across all sessions per week. |
Total amount of time spent in apps throughout the week. |
|
6.55 launches per week |
7 minutes, 13 seconds per week |
47 minutes, 17 seconds per week |
User Retention
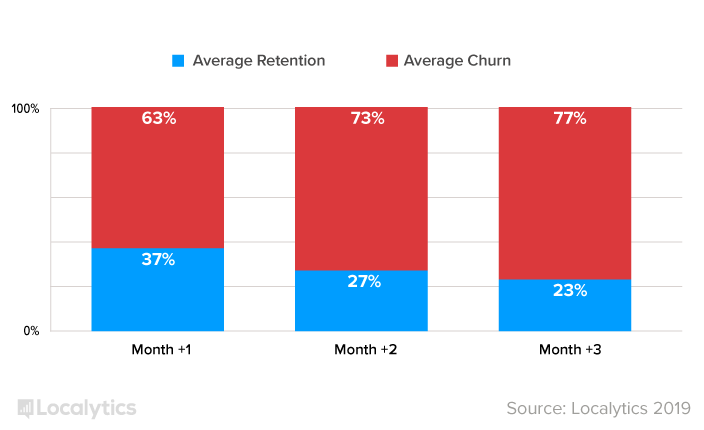
Average Three Month User Retention and Churn
Retention measures the percent of users who return to an app one month, two months, and three months after the app is downloaded. Churn is the opposite; it measures the percentage of people who do not return to an app one month, two months, and three months after download.
According to our data, 37% of users are still using apps one month after they downloaded it, meaning 63% of users have churned and are no longer using the app one month after they downloaded it.
Three Month User Retention & Churn
Average for All Apps
Marketing Stats
| Push | In-App | |
| Open Rate | 4.2% | 7.1% |
| Conversion Rate | 2.1% | 1.8% |
| Engagement | 5.61 | 18.1 |
| Push | In-App | |
| Open Rate | 2.1% | 9.8% |
| Conversion Rate | 0.93% | 4.3% |
| Engagement | 8.01 | 46.5 |
- Open Rate is measured as the percent of users who clicked on the message within the first day of receiving it.
- Conversion Rate is measured as the percent of users who clicked on the message and then fulfilled the desired conversion event within the first day of receiving the message.
- Engagement is measured as the average number of sessions recipients of the message
had within the first week of receiving the message.
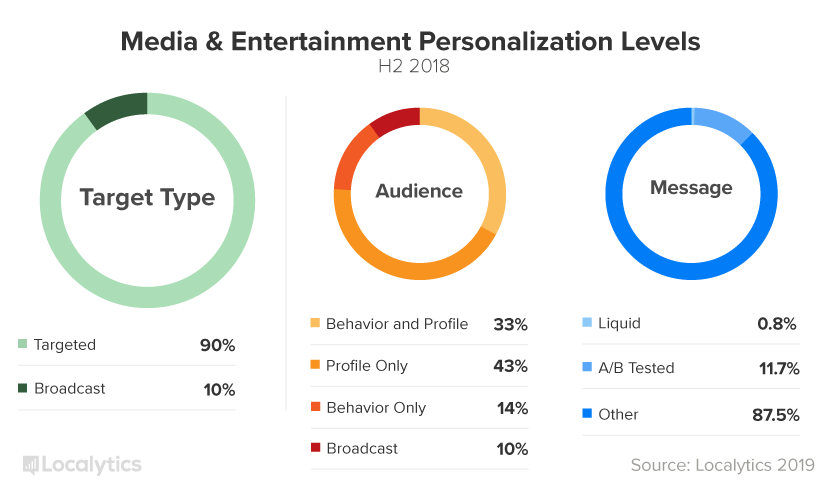
Personalization Stage: Beginner
Based on our proprietary Stages of Personalization methodology, Media and Entertainment apps fall into Stage One: Beginner based on high use of profile targeting, very low use of liquid messaging, high use of A/B testing, and high use of broadcast messaging relative to other industries.
Localytics is the leading mobile engagement platform across more than 2.7 billion devices and 37,000 mobile and web apps. The timeframe for this data is for the second half of 2018.