Sometimes the most shocking data is the least expected.
Kapost recently completed our first industry-wide survey, a 21-question SurveyMonkey probe into the state of hiring within the B2B content marketing industry. The results were powerful, gathering insights from more than 500 marketers across the world.
But one of the most immediately interesting discoveries was not from the actual data collected. Rather, it came from data acquired during the administration of the survey.
Namely, survey completion rates are extremely low for non-customer surveys.
There are ample numbers reported for surveys administered to customers (usually 10%-40% as reported from this source, this source). So when we started out with an average survey completion rate of 1.52%, our brows furrowed with disappointment.
Yet, we started to wonder if 1.52% was really so bad. Frankly, it was hard to tell. Finding survey response rates for non-customer groups is much harder than for customer groups. Several hours of Google searching—and asking SurveyMonkey for data directly—turned up nothing.
We then turned to our friends in content marketing. Publicly, Content Marketing Institute’s annual benchmark report reports they received 1,416 surveys—but out of how many sends? There are no publicly displayed figures (that we could find).
Finally, we tweeted Joe Pulizzi, who put us in touch with their Research Projects Director, Lisa Beets, who said their completion rate was .5-1%.
This conversation led us to believe that a low figure may be more common, and just isn’t something people like to flaunt.
So, in the name of transparency to and for B2B marketers, we’ve decided to share our experience with our survey. We hope by doing so we help us all become better marketers by:
- Adding to B2B survey literature on non-customer survey completion rates
- Bolstering public access to non-customer survey response rates
- Starting a conversation about survey participation
Please comment below i you have your own experiences or information to share.
The Nitty Gritty
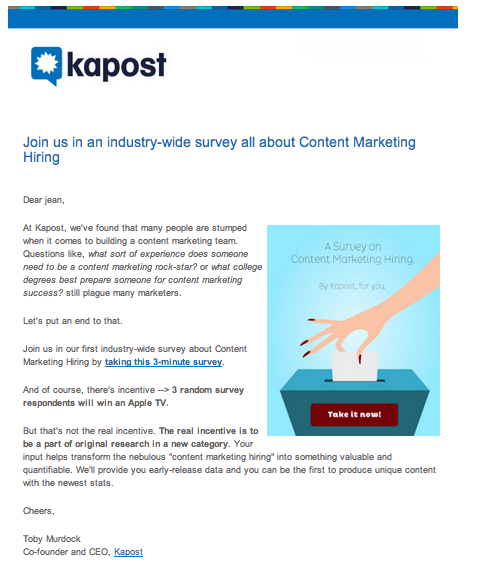
Our email survey was sent to 32,414 marketers who we thought would be interested in both (i) taking a survey and (ii) receiving industry supported data on trends within the content marketing hiring process. The survey was sent in two email blasts, with the same subject line, body copy, and image. Everyone who completed the survey was automatically entered to win one of three Apple TVs (a $99 value each), and was promised early release of the survey data.

The first batch of surveys was successfully sent to:
- To 23,310 business email adresses
- With a 15.34% unique open rate
- With a survey completion rate of 1.1%
The second batch of surveys was successfully sent to:
- To 9,104 personal email addresses
- With a 25.6% unique open rate
- With a survey completion rate of 2.6%
Our Reaction
These results surprised both me, and our marketing operations gurus, in two ways.
First, we were ashamed of our response rate. I’m talking a tail-between-the-legs, oh-goodness-that’s-bad kind of reaction. But after speaking with others in our industry, we now know that 1.1%-2.6% is actually quite good.
Second, we expected business email addresses to outperform personal email addresses. Since this was a B2B marketing survey, we thought business email addresses would be the best way to contact marketers. We thought people would be more likely to participate in this survey in a business setting, since the data would ultimately be used to inform B2B best practices. However, that ended up not being true. Survey completion rates were over two times higher for personal email addresses than business addresses.
Our hypothesis is that people want to keep work inboxes work-related, used only for necessary interactions (like meeting invitations or project updates), information (such as newsletter subscriptions or opt-in marketing emails), and important communications (partner, customer, or prospect conversations) that are directly related to their jobs. However, when accessing their personal email addresses they may have more free time for things like completing surveys. Or perhaps business email inboxes are configured differently compared to personal email addresses, such that surveys have better visibility in personal inboxes.
It’s still inconclusive, we know. We feel like borderline experts in the context of content and email marketing. Yet, this was a stumper.
So What’s Next?
As always, we took a look at the data, and tried to make sense of it. Now, here’s how we’re responding to the experience:
- In this case, we are documenting each step of the industry-wide survey to make it easy to replicate for future years of research
- We are sharing our survey response rates with our network, to try to get your opinion and shared data
- We started a LinkedIn conversation to see if other marketers have had better response rates or know any best-practices to increase completion rates
- We are keeping an open, Agile mind in order to be better surveyors and marketers in the future
Here’s one more stat for you: we are 100% excited about the survey data that we collected! An unbelievable amount of raw data and information came from this survey, and we can’t wait to share the results.
Get the Latest in B2B Marketing Strategy
Never miss a chance to make your content even better by subscribing to our weekly newsletter to get more tips and tricks for creating best-in-class content.

