Data Enrichment: The Secret to Turning Emails into Dollars
Data Enrichment: The Secret to Turning Emails into Dollars
8 minute read

Standing out in a crowded inbox is no small feat. That’s why today’s email marketers are turning to data-driven strategies to supercharge their marketing campaigns. To start your data-driven journey, it’s crucial to evaluate the value of your email list. On a scale of 1 to 10, how would you rate it? Consider the types of additional information and the quality of the data you have. Is your email list just a collection of names and email addresses or do you have rich, quality data that can truly enhance your marketing efforts?
With data enrichment, you can transform a basic contact list into a goldmine of insights. Imagine each of your email addresses enriched with valuable subscriber information like demographics, purchase history, and social media activity. This isn’t just about accumulating more data – it’s about having the right data to craft personalized, impactful messages that truly resonate with your audience.
In this short read, we’ll dive into the world of data enrichment and discover how you can use it to elevate your campaigns to new heights.
What is Data Enrichment?
Simply, data enrichment is the process of enhancing your existing data with additional data. It elevates a simple contact list into a detailed customer view to help you create a more comprehensive and accurate profile of your audience, which is key for improving the accuracy and effectiveness of your email campaigns.
As we mentioned earlier, you might start off with a person’s name and email address. By using data enrichment, you can append further information like their geographic location, purchasing behavior, and lifestyle preferences. Having more relevant information in this way can significantly increase the likelihood of the subscriber opening and engaging with your emails.
The benefits of using data enrichment include enhancing your ability to target, personalize, and boost campaign performance. Data-enriched email campaigns can achieve a 20% increase in open rates and higher conversion rates through improved personalization. This approach also helps reduce customer churn by maintaining meaningful communication with customers, which is crucial for retention. Businesses that utilize enhanced profile data for personalized messaging report higher customer loyalty.
Why not try it and see what it can do for your campaigns? It’s super simple to do and if you’re already an Adestra user – a whole world of data-analytics has been recently added!
How can I enrich my data?
Let’s focus on two powerful data enrichment methods: calculated fields and data bandings (both available within Adestra’s new Audiences!).
Calculated fields
Calculated fields are a powerful tool for marketers to use as they allow for the creation of new, insightful data points from existing data. For example, if you have the date of birth information of your subscribers, you can create a calculated field to determine each subscriber’s age. This enables you to customize promotional offers based on life stages, such as offering educational subscriptions to younger subscribers and retirement planning articles to older subscribers.
Additionally, you could use this method to identify high and low value subscribers. By analysing subscription history, you can calculate the average revenue or lifetime value of each subscriber. These new fields help you to send exclusive content or early access to new issues to high-value customers and/or introductory offers to low-value customers to encourage more engagement.

Calculated fields enrich your dataset by providing new insights that aren’t directly available from your raw data. They can then be used for deeper segmentation, allowing for precise audience targeting and more effective, tailored messages. By leveraging calculated fields, marketers can enhance personalization, improve engagement and ultimately drive better results from their email campaigns.
Data bandings
Data banding is the process of grouping data into specific ranges, or bands, to analyze patterns and trends. There are a few ways you can band your data, but we’re going to be focusing on three: date, numeric, and parametric.
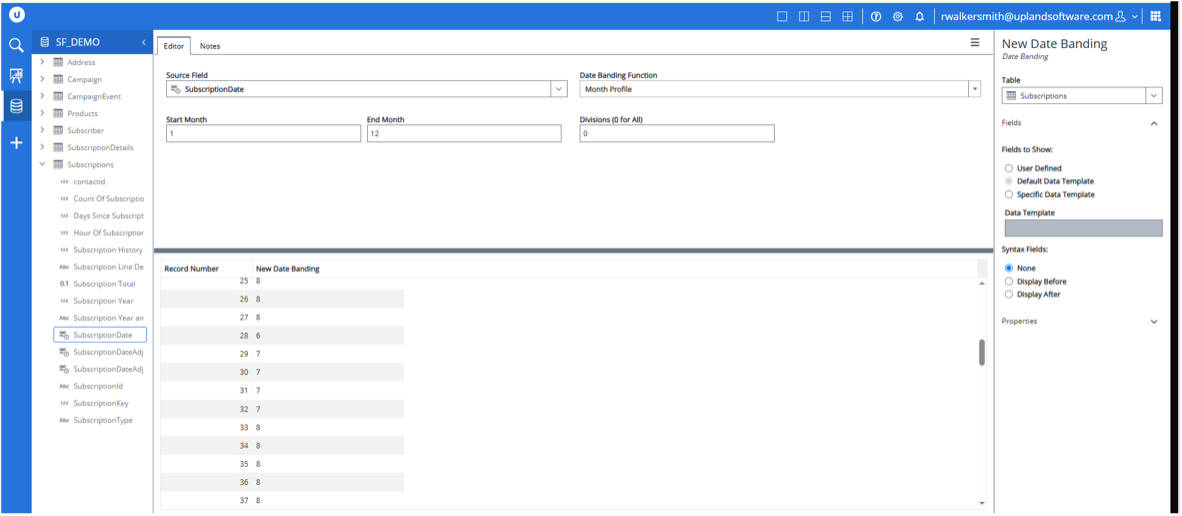
Date
This technique is used for grouping dates into intervals or ranges, such as weeks, months, or years, which can be used to segment subscribers based on specific periods of time such as last purchase date, subscription start date, or milestone anniversaries.
For example, you could group subscribers based on their subscription start date such as “new subscribers” (0-3 months), “recent subscribers” (4-12 months), and “long-term subscribers” (12+ months). This segmentation enables you to tailor content and offers for each group where you might send long-term subscribers loyalty perks or special anniversary messages whereas you might want to send introductory offers to keep engagement high for the newly subscribed to hold their interest until a deeper value has been realised.
Harnessing this data allows you to automate lifecycle marketing campaigns and time-sensitive campaigns easily. For instance, you can set up automated re-engagement campaigns targeting customers how haven’t made a purchase in six-months, ensuring you reconnect with them at the right moment.
Numeric banding
This technique is used for numerical data such as spending brackets, number of interactions, or age groups to help you categorize your data into defined ranges.
For example, you might want to create numeric bandings based on the number of articles read per month. Subscribers can be grouped into bands such as “light readers” (0-5 articles), “moderate readers” (6-15 articles), and “heavy readers” (16+ articles). This segmentation enables you to tailor content and offers for each group where you might recommend popular articles for light readers to increase engagement whereas heavy readers might get access to early access to pre-orders.

Parametric
Parametric banding is similar to numeric banding, but this technique can include more complex criteria. In the example above, we explored banding readers by how many articles they read. We can take this one step further with parametric banding. Instead of just considering the number of articles read, you can incorporate additional parameters like the types of articles read, the time spent reading, and the frequency of visits.
For example, subscribers can be grouped into bands such as:
- Light readers: who read 0-5 articles per month with an average reading time of less than 2 mins per article
- Moderate readers: 6-15 articles per month, with an average reading tome of 2-5 minutes per article
- Heavy readers: 16+ articles per month, with an average reading time of more than 5 minutes per article

Numeric banding provides a simple method to segment readers based on the number of articles they read, making it useful for basic engagement analysis, especially if you’re new to data-driven strategies. However, parametric banding takes this a step further by offering a comprehensive picture of view of reader behavior. This enables marketers to refine their content strategies and make more informed decisions.
Are there any best practices I should know?
To ensure the accuracy and reliability of your data, it’s essential to adhere to data privacy regulations, such as GDPR and CCPA. These regulations not only protect consumer information but also build trust with your audience. Implementing best practices like regular data audits, validation rules, and data standardization can help maintain your data quality. This proactive approach ensures your marketing efforts are both effective and compliant, setting you up for long-term success.
In summary, we’ve explored how you can stand out in a crowded inbox by supercharging your marketing campaigns with data-driven targeting, such as data enrichment. Transforming generic marketing messages into personalized, impactful communications that truly resonate is the key. If you are keen to explore these capabilities further – we’ve got you covered! Adding enriched data is now easier than ever with advanced features for data-driven targeting. Adestra’s new Audiences offers robust data visualization capabilities, pivot tables to simultaneously cross-analyze multiple email marketing data points, and powerful methods for enriching your email data (as you’ve seen throughout this blog). Speak with us today – contact your CSM or schedule a demo – to boost your marketing to new heights!
Final word from us at Adestra
“Adestra users can now unlock untapped opportunities within their customer data, giving marketers valuable insights to drive success and allowing them to focus on generating more demand, while driving revenue growth.” said Shawna Weaver, Senior Vice President and General Manager of Audience Engagement products at Upland Software.
We are committed to driving revenue for marketers by empowering them to turn data-driven decisions into actionable insights. We’re excited to be providing cutting-edge data capabilities that put our customers in a position to drive greater engagement. Speak to our team today, or directly with your Customer Success Manager, about how you could benefit from using Adestra’s latest range of data-driven marketing capabilities, called Audiences.
You might also be interested in this recent blog post: The Art of Precise Targeting: How to Segment Audiences for Maximum Impact.