What happens when you convene stakeholders to discuss which content marketing metrics indicate success?
Lead generation, page views, newsletter signups, eBook downloads…you gather a diversity of opinions that would make Google jealous.
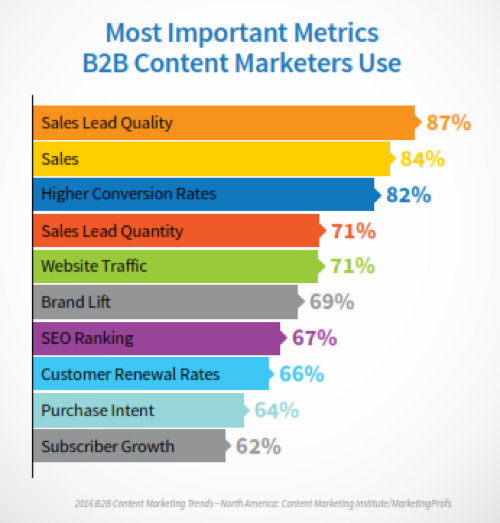
However, variety doesn’t help you achieve better results or articulate value to the C-suite. When you’re under pressure to prove the ROI of your content operations, it’s frustrating.
Our latest benchmark finds this discussion to be commonplace in B2B organizations. Content creators and marketing leaders can’t agree on the barriers to success or the metrics needed to show ROI. Yes, access to key data promotes growth. But these misalignments are hampering revenue.
Want to see the full report? Download the B2B Content Operations and Strategy Benchmark here.
Only 41% of B2B marketers have clarity on the success of their content marketing, reports CMI. Without a consensus around data, nothing gets measured, and nothing gets improved. Many waste time and resources chasing the wrong metrics, further disrupting the success of their content operation.
And what is a content operation?
A content operation is the set of processes, people, and technologies for strategically planning, producing, distributing, and analyzing content.
When properly implemented, it unifies the customer experience across departments and channels, allowing marketers to focus on authentic, resonant messaging that drives revenue and growth.
Today, we show you how to measure the ROI of your entire content operation with four critical metrics. These signposts will remove any doubts about content performance, allowing you to demonstrate the true value of your content, loud and clear.
1. Revenue Driven by Marketing Leads

(Source)
Demonstrating the ROI of your content operation starts with finding the revenue per marketing lead.
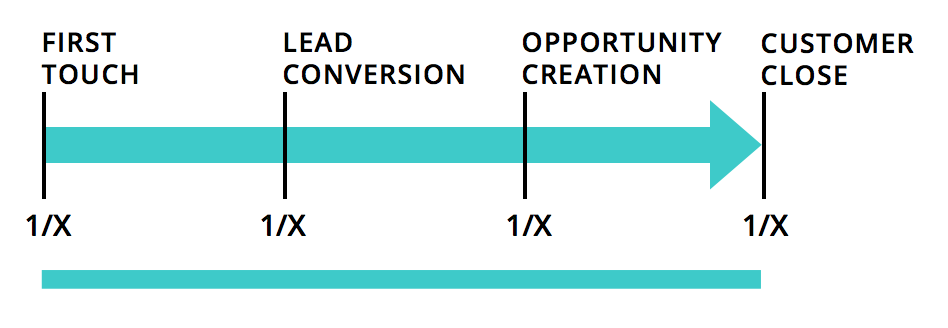
To determine which customers arrive via marketing, track the interactions stored in your CRM and automation platform. Follow these touch points across marketing initiatives and campaigns until the final sale.
Sales and marketing should collaborate around how to assign value for generating or closing leads. Otherwise, you risk misattributing credit for the close. This dialogue hinges upon where and how leads enter the funnel, but it also looks to behavior going forward.
Say the first touch is a LinkedIn ad for a white paper. This is followed by a download on your website, a couple of blog views, a product demo, then a purchase. This customer journey clearly shows a marketing-driven lead. After tallying all similar journeys that led to a sale, you can assess their collective impact on the bottom line.
To calculate revenue per marketing lead in a given period, divide the revenue earned from leads by the total number of marketing qualified leads (MQLs). For example, if revenue is $1.2 M and marketing leads equals 120, then revenue per marketing lead comes to $10,000.
What if your quarterly revenue goal is $500,000 and marketing is responsible for 50%? After benchmarking against lead revenue from last quarter, you know you’re responsible for contributing 25 leads.
Assigning leads a dollar value allows you to set revenue goals in terms of leads generated. Now you can rally the sales and marketing teams around a concrete number – and give leadership segmented proof that your content operation is pulling its weight.
2. Lead Quality

(Source)
Lead quality shows you how aligned your content is with your customers.
If you’re flush with qualified leads, your content is resonating with its target audience. But if lead quality is lacking, reevaluate how your content journey speaks to your customers’ needs.
The fitness of your content operation is reflected by how well it attracts the right leads. That means distributing valuable full-funnel content. This is a struggle for most organizations.
According to Smart Insights, 48% of marketers say that only half of their leads are of “good quality” and ready for nurturing or sales. Our recent report confirms this, revealing that 67% of marketers have minimal to zero visibility about coverage gaps across key attributes like buyer persona, buying stage, and product line. Without a firm grasp of how content maps to the customer journey, it’s no surprise that lead quality remains a challenge.
Lead scoring allows you to assess lead quality, but also to evaluate the quality of your content journey. High numbers indicate that you’re consistently attracting and engaging leads in a way that pulls them down the funnel. Low numbers speak to deficient or misaligned content assets that don’t deliver value. Simply put, the greater number of high-scoring leads, the more meaningful and aligned your content is to your audience.
This metric signals how robust and effective your content operation is at driving leads to sales.
3. Number of Leads Created

The number of leads you generate indicates both the reach and quality of your content.
Our benchmark study found lead generation to be the number one priority for B2B marketers, yet only the highest-performing brands are achieving their lead generation goals.
Why?
Because leading brands have a well-articulated customer journey that distributes content to prospects via every relevant channel.
However, most marketers with fewer resources must prioritize engagement across preferred channels. Understanding the best approach for your content program means regularly evaluating lead volume while also maximizing existing resources.
Assess the customer journey by where you’re generating leads and opportunities, but also where you’re falling short. Are there coverage gaps in certain channels and initiatives? Where are your conversion gaps? The areas where you find engagement lacking is where you should allocate your best content, effectively enhancing your reach.
To gauge how well content generates leads across channels, apply content scoring. This is a multi-touch attribution model that rates content by its performance related to specific objectives. Pinpointing your best-performing assets brings insight into how to optimize content for conversions.
Content scoring ensures that each asset resonates with prospects and brings you closer to your lead generation goals. Assign values for relevant demographic and behavioral markers, then compile the data and tally the scores. Whether you calculate manually or save time with a content scoring tool, you can now rank and prioritize leads while assessing the impact of your content. Leverage this technique to gain a granular view of the conversion process, demonstrate the ROI of single assets, and rally stakeholders around content strategy.
4. Conversion Rates

Though lead gen is key, the value of your content operation is ultimately determined by its ability to translate leads into sales.
Conversion rates testify to the relevance, resonance, reach, and responsiveness of your content operation. Considering the revenue lost by companies without a coordinated content system, it’s no surprise that 87% of CMOs want more insight into content performance.
To calculate your conversion rate, ask the sales department how many of last quarter’s leads converted into opportunities and closed deals.
Say you’re converting 33% of leads and your average customer spends $1,000 on your product. If you’re bringing in 12 leads per month and converting a third of them, your monthly pipeline revenue is $3,000. With a concrete number in hand, you can calculate the ROI of your entire content operation.
You can also score content to isolate the touches that drive the most revenue. To maximize revenue-driving conversions, bring this high-performing content to the forefront of your program.
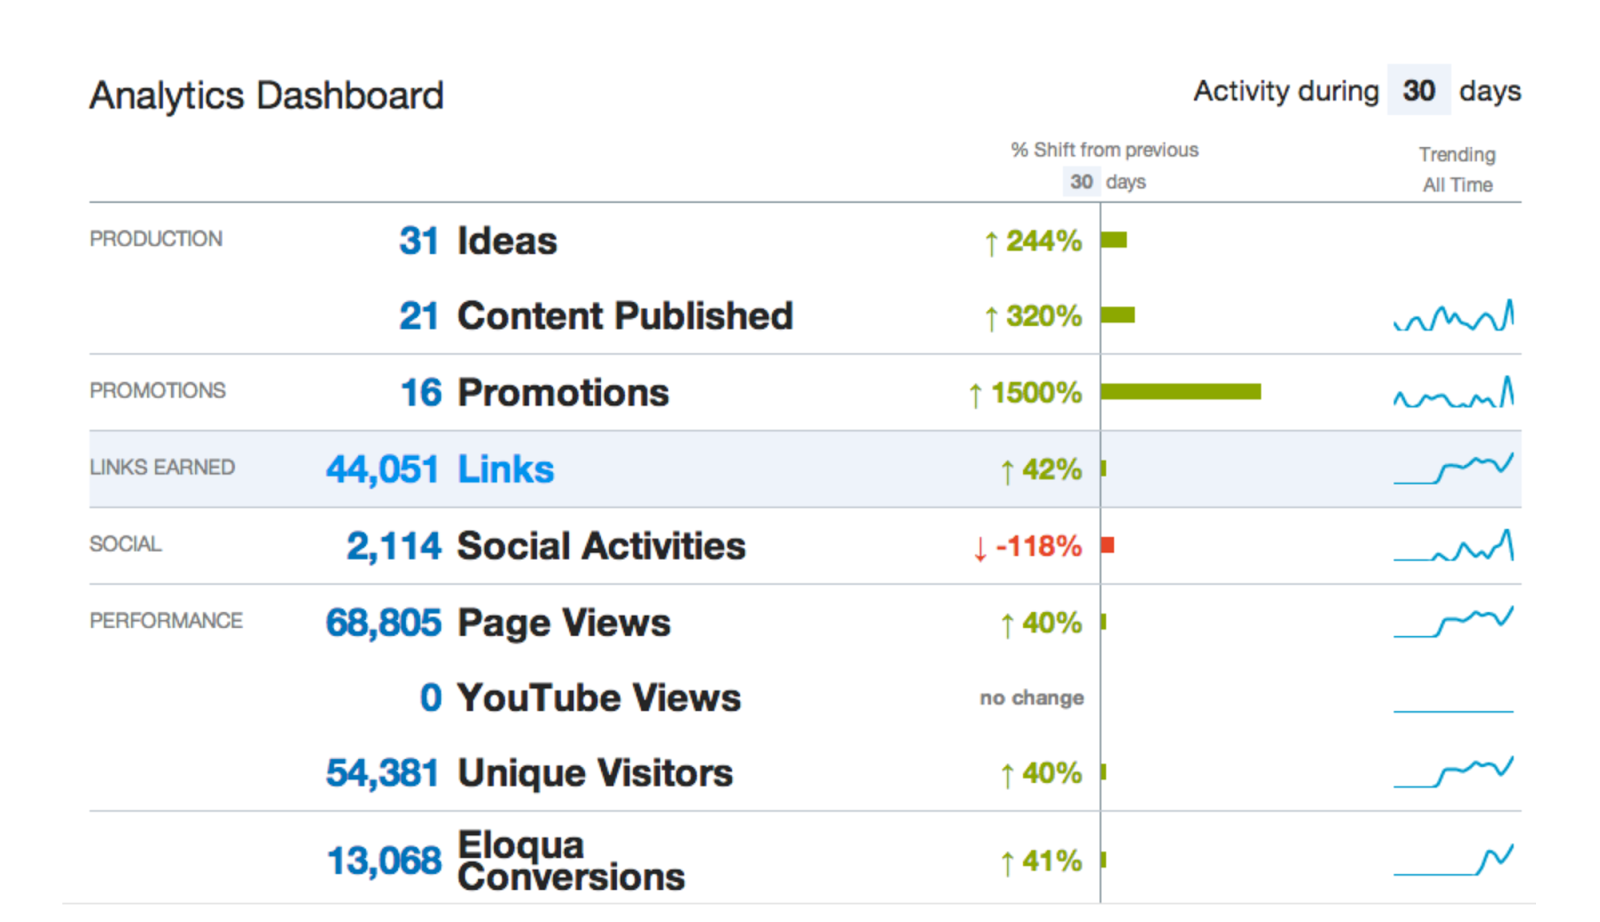
But since content serves multiple uses—from brand awareness to sales enablement—balance your short and long-term goals by attending to your entire funnel. Reach and engagement stats like social shares, pageviews, and time on page are useful to the content marketing team. Build visuals of these KPIs in your content metrics dashboard, or use a tool that does it for you.
From demand gen or lead gen, email opens to eBook downloads—proving ROI means detailing content performance in terms of revenue and optimizing wherever possible.
Find Success With Your Content Operation
These four marketing metrics are the pillars of a robust and effective content operation. Only revenue-focused data points can illuminate how content quality, reach, and engagement are affecting the bottom line.
Revenue per marketing lead provides a snapshot of content impact. Lead quality helps you align content with the needs of your target audience. Lead volume offers perspective about reach, while content scoring permits a detailed view of how a single asset affects revenue. Finally, examine conversion rates to check the pulse of your content operation and understand how well you’re pumping revenue through the pipeline.
You can gain access to the latest insight within your content marketing community by downloading our latest report: The B2B Content Strategy & Operation Benchmark.

