
Walk through any manufacturing facility and you’ll notice they all have the same type of charts displayed on the walls, bulletin boards, or electronic displays highlighting results of lean six sigma programs. The shop floor constantly runs Kaizens to improve factory-floor operations.
Surprisingly, most of the emphasis on the shop floor has been on streamlining production, relocating equipment, reducing production down time, and optimizing production capacity. Everything is focused on activities within the four walls of the factory shop floor. A very small percentage of these activities revolve around improving on-time-delivery, or improving supplier collaboration and material availability (i.e. processes that are occurring outside the facility).
In spite of these well-intended and dedicated efforts, when I walk through a typical shop floor, the two most common statements I hear are: “I have too much inventory” and “I can’t find what I want.” Why don’t we see more emphasis on having the right parts (raw material, work-in-process, and finished goods) at the right place at the right time?
 It is not as if practitioners are unaware of the issues or don’t want to focus on inventory problems; it’s just difficult to collect necessary data to do this analysis. As with everything else, diagnosing the problem (what/where/when/why) is 80 percent (or is it 99 percent?) of the effort involved here. The data that is available in MRP systems is transactional and batched. Even though the data may be current and accurate (mostly) it is not possible to clearly identify when a stock-out happened (MRP back-flushes only when the material is available) or why someone ordered so much.
Our goal in developing the Inventory Optimization Tool (IOT) was to aid the diagnostic process by removing the complexity and presenting the data in a form that can be easily understood not just by lean six sigma black belts but also by material management people.
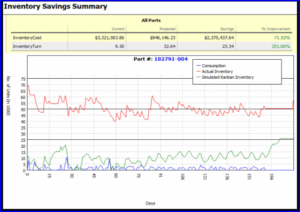
I like to think of it as an MRI scanner for inventory management. Using a patent-pending simulation engine, the Inventory Optimization Tool back-simulates the MRP transactions, calculating the on-hand inventory for each day of a historical period (6 months, 1 year etc.). It then superimposes the consumption-driven replenishment pattern to estimate the potential inventory reduction for each day as well as the overall average for the period.
The Inventory Optimization Tool identifies, for each part, the following:
- Standard daily usage (average consumption for the period)
- Safety stock (based on service levels, lead time)
- Consumption variance (S/X ratio – standard deviation/mean)
- Potential stock-outs
- Average inventory needed to meet the consumption pattern
The key aspect of this tool is that the analysis is based off of actual consumption, not forecasted or planned demand. So it is possible for you to do “what if” analysis by manipulating the supplier’s lead time, standard lot size, the safety stock service levels, average consumption etc. — in real time. The inventory savings will be automatically recalculated to show the impact of your changes.
Whether your replenishment methodology is MRP or something else, the Inventory Optimization Tool will clearly show where the problems lie and identify areas for potential improvement. The tool is highly visual so you can see a graphical representation of your actual demand, your historical on-hand levels, your current replenishment pattern, and simulated Kanban replenishment pattern – all on the same graph. Register to sign up for a free trial of the Inventory Optimization Tool today!