2019 Mobile App Benchmark Report to Inform Your 2020 Strategy
2019 Mobile App Benchmark Report to Inform Your 2020 Strategy
We created this benchmark cheat sheet to provide a deep look into brands’ mobile app performance, both overall and broken down by industry, based on our database of more than 37,000 apps
Is your mobile app marketing strategy underperforming, meeting or exceeding industry standards? Knowing the trends within your industry can help your brand benchmark its performance and understand what more it can do to remain competitive, relevant, and an industry leader.
We created this benchmark cheat sheet to provide a deep look into brands’ mobile app performance, both overall and broken down by industry, based on our database of more than 37,000 apps. We’ve focused on benchmarking data around several key metrics imperative to brands—app engagement, user retention, and the impact of a mobile marketing strategy such as opt-in rates, open rates, engagements, and conversions. Each of these metrics help brands determine where their brand sits among industry leaders, industry average, and those needing to catch up. The data is aggregated from Upland Localytics’ platform based on mobile app usage in 2019.
By comparing our industry-wide metrics to your own app’s health and performance, organizations will be able to diagnose how your brand’s mobile app marketing strategy stacks up so you can better serve your customers’ brand experiences.
Below you can find overall mobile app benchmarks and the benchmarks for your specific industry. Throughout the benchmarking, we’ll dive deep into what the data is saying, what it means for you and your app, and more. Then, jump to your industry to find how your app compares to others in your industry.
- Retail
- Financial Services
- Media & Entertainment
- Travel
Overall Benchmarks
Monthly App Engagement
| App Launches | Session Length | Time in App |
| Average number of times an individual app is launched per month. |
Average time spent in an individual app across all sessions per month. |
Total amount of time spent in apps throughout the month. |
| 10.8 launches per month | 5 minutes, 26 seconds per session | 58 minutes, 39 seconds per month |
Weekly App Engagement
| App Launches | Session Length | Time in App |
| Average number of times an individual app is launched per week |
Average time spent in an individual app across all sessions per week |
Total amount of time spent in apps throughout the week |
| 4.99 launches per week | 5 minutes, 26 seconds per session | 27 minutes, 6 seconds per week |
Take these as the standard benchmarks for app performance across company sizes and industries and compare it to your app’s metrics. Are you on par, ahead of the curve or slightly behind? Using this information, brands can determine whether their app is currently an asset or liability, and knowing that can help showcase what brands are doing right and where they need to course correct.
By measuring app launches and time in app, we can showcase the current state of the mobile market. According to our historic data, app launches have slightly decreased over the years, however time in app and per session, has been on the rise. This is showcasing that brands must put everything in their arsenal to grab users’ attention. Users are spending more time in apps, about one minute longer per session. Last year, users spent an average of 59 minutes per month on an app, whereas this year they spent slightly shy of that, showcasing that fewer launches but longer sessions results in a steady amount of aggregated time within the app.
Ask yourselves: Are your users spending more or less time on your app than the benchmarks above? Are they launching it more?
User Retention:
Average Three Month User Retention and Churn
Retention measures the percent of users who return to an app one month, two months, and three months after the app is downloaded. Meanwhile, churn measures the opposite. Churn is the percentage of users who don’t return to an app one month, two months, and three months after download.
These are imperative metrics to be tracking within your app and compare them to your industry’s benchmarks. Retention and churn are some of the best ways to diagnose problems and successes in your mobile platforms. If your churn is higher than average, you can diagnose that there may be UX problems, whether that’s clunkiness, siloed channels, or poor design, within your mobile app. With further analysis, you can even find where your users are churning within your app experience.
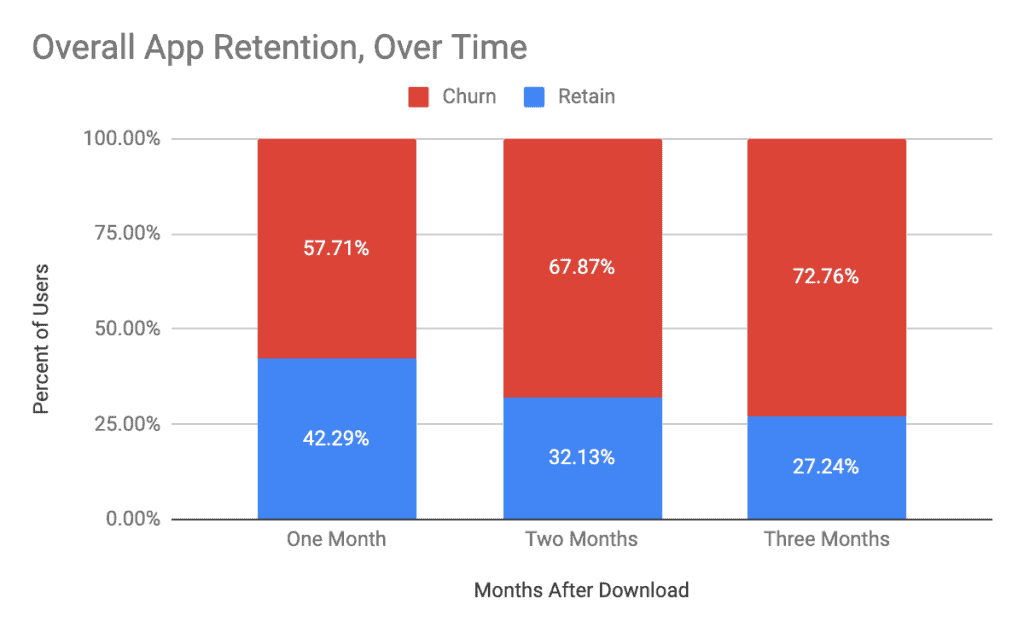
According to our data, 42.29% of users are retained one month after downloading the app, meaning 57.71% of users churned one month after download. Three months after download, almost 73% of users churned.
The majority of users will delete an app or become inactive soon after using it. To overcome this, brands have to make sure their mobile experience offers a great first impression if you hope to retain them. But while these numbers seem bleak, apps have been finding more success with retaining their users since we began tracking data. At the beginning of 2016, apps were churning 64% of their users one month after download, and 80% of users three months after download. Brands have learned to retain an additional 7% of users over both short and longer terms.
Marketing Metric Benchmarks
Measuring the marketing power behind your app is so important—by knowing what your app could be capable of, it’s much easier to know how to utilize it to monetize it and deliver a great customer experience. After all, apps should be designed as one of your many streams of revenue and provide an additional channel to engage your customers.
And by knowing the marketing capabilities, brands can learn things such as whether messages are being delivered to users’ phones, and why brands may be above or under the average, whether their messages convert, and if their engagements are effective.
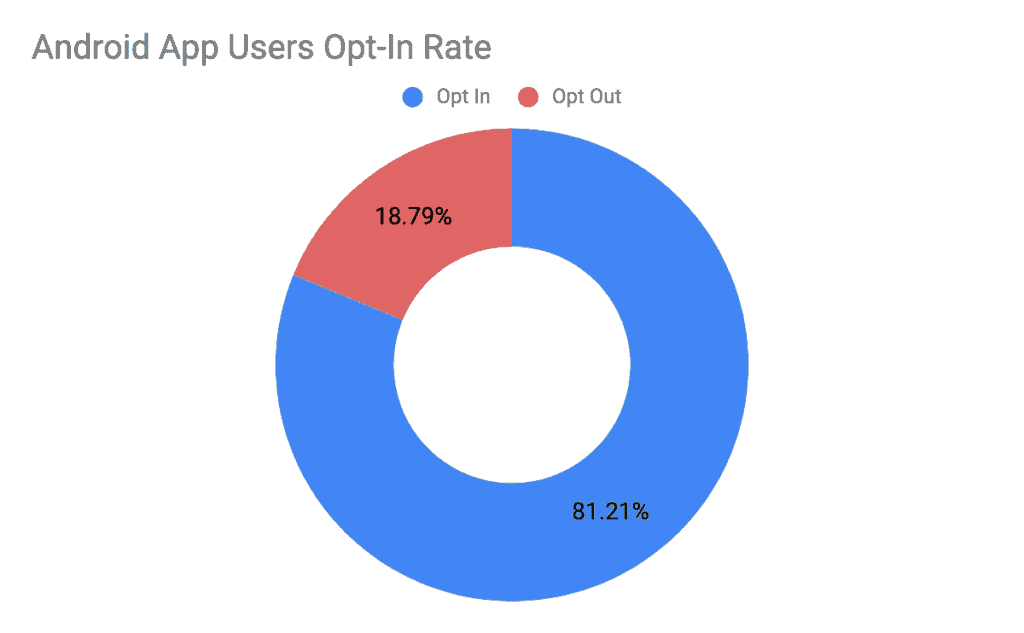
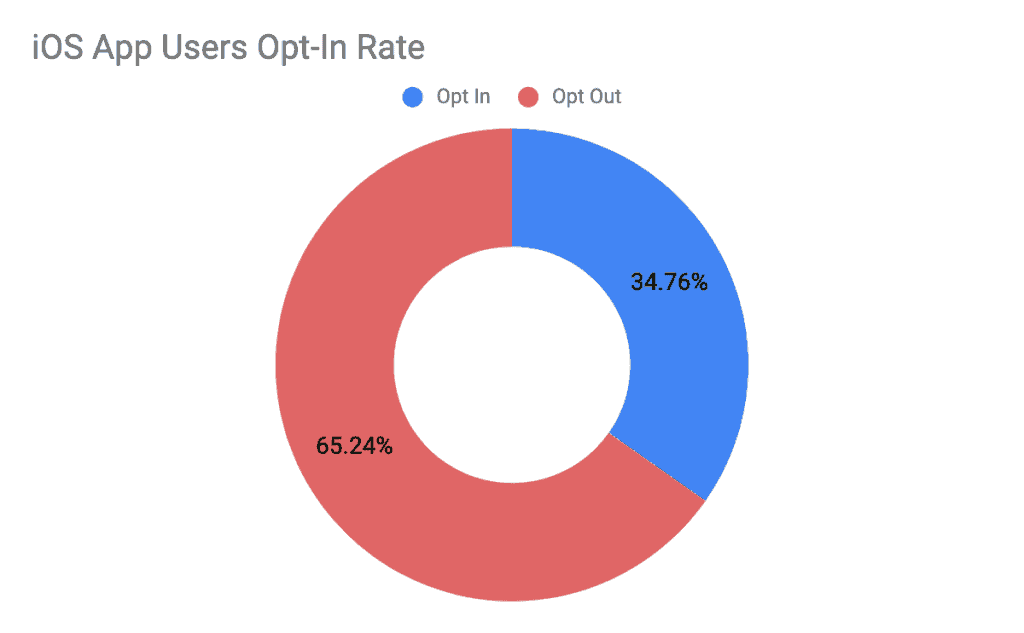
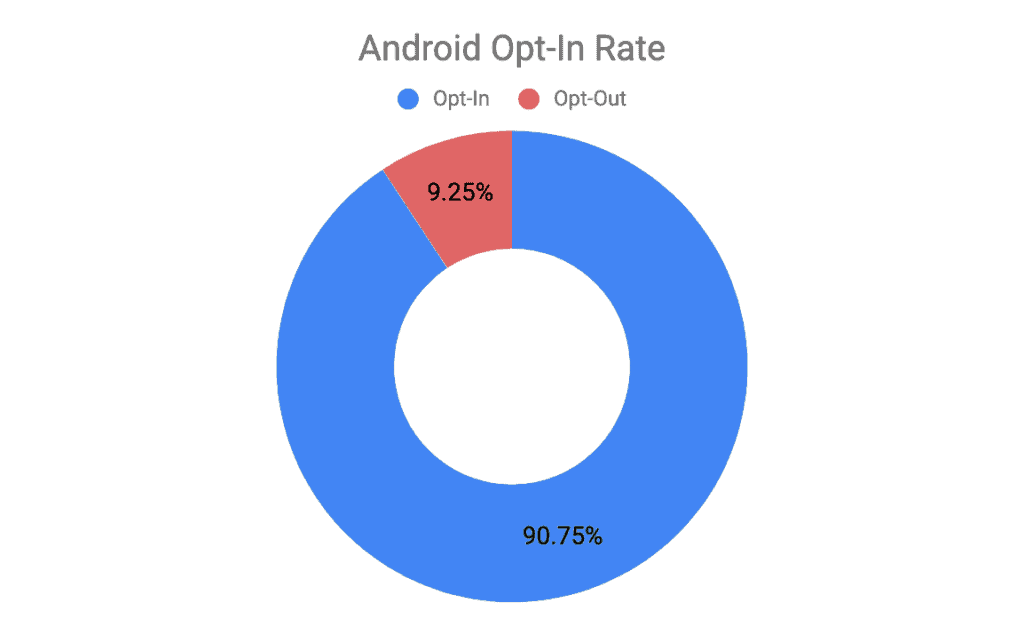
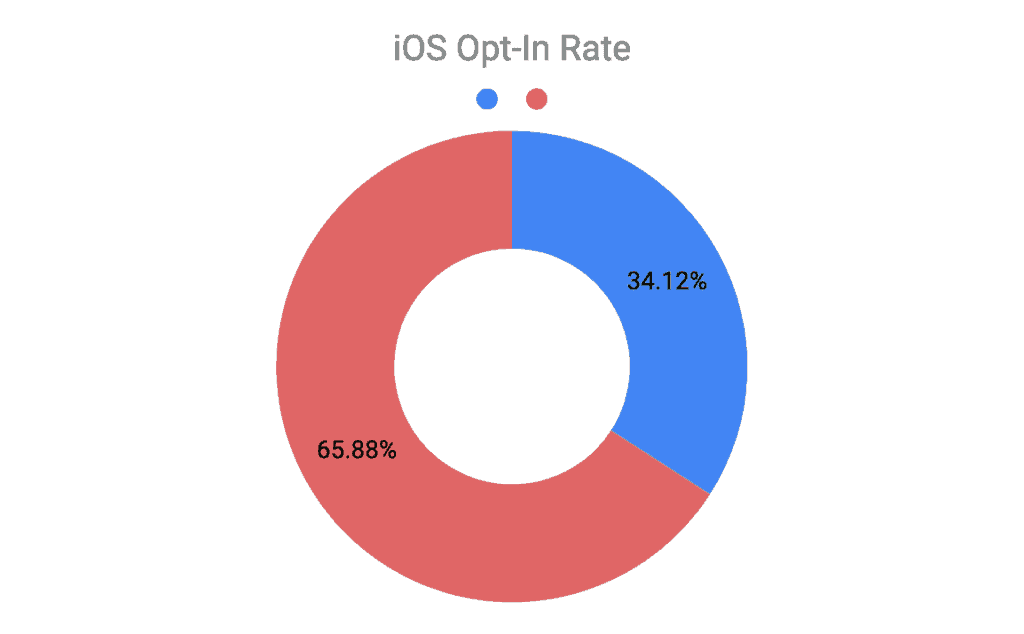
We measured the overall app average for opt-in rates, open rates, conversion rates, and engagements, split between Android users and iOS users. We define these terms as:
- Open rate is the percent of users who opened the message within the first day of receiving it.
- Conversion rate is the percentage of users who clicked on the message and then fulfilled the desired conversion event within the first day of receiving the message.
- Engagement is measured as the average number of sessions recipients of the message had within the first week of receiving the message.
Android Users
| Push | In-App | |
| Open Rate | 3.60% | 12.25% |
| Conversion Rate | 1.12% | 4.13% |
| Engagement | 2.94 | 18.00 |
iOS Users
| Push | In-App | |
| Open Rate | 3.49% | 15.88% |
| Conversion Rate | 0.81% | 5.98% |
| Engagement | 3.44 | 21.45 |
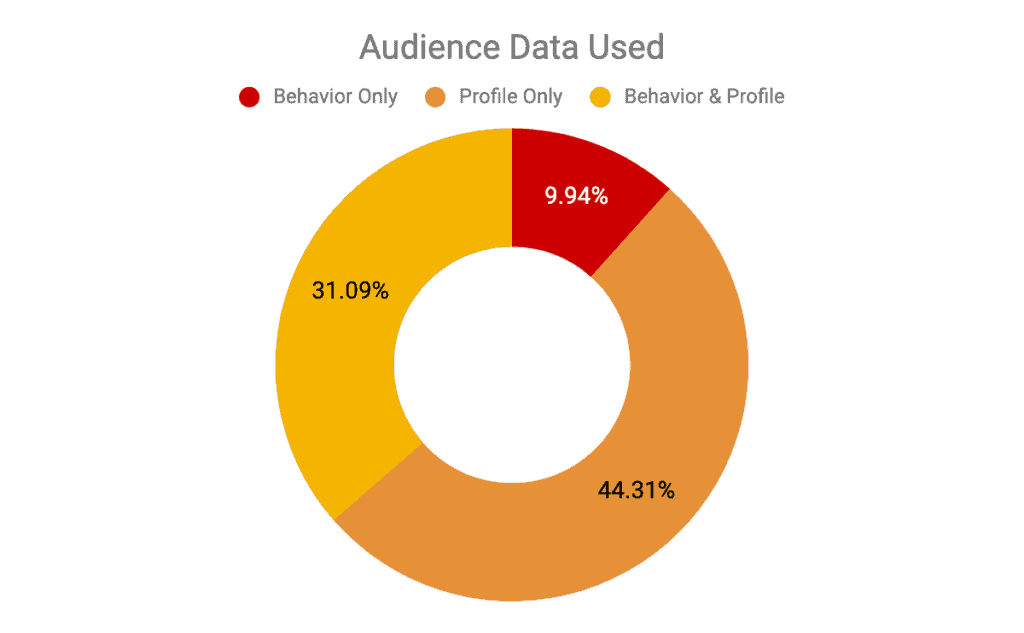
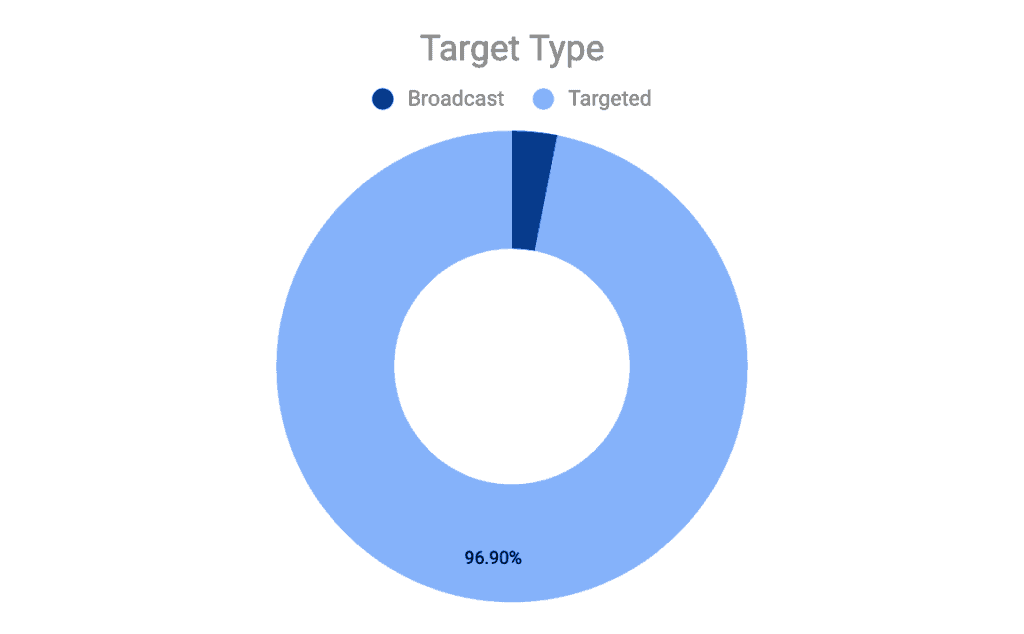
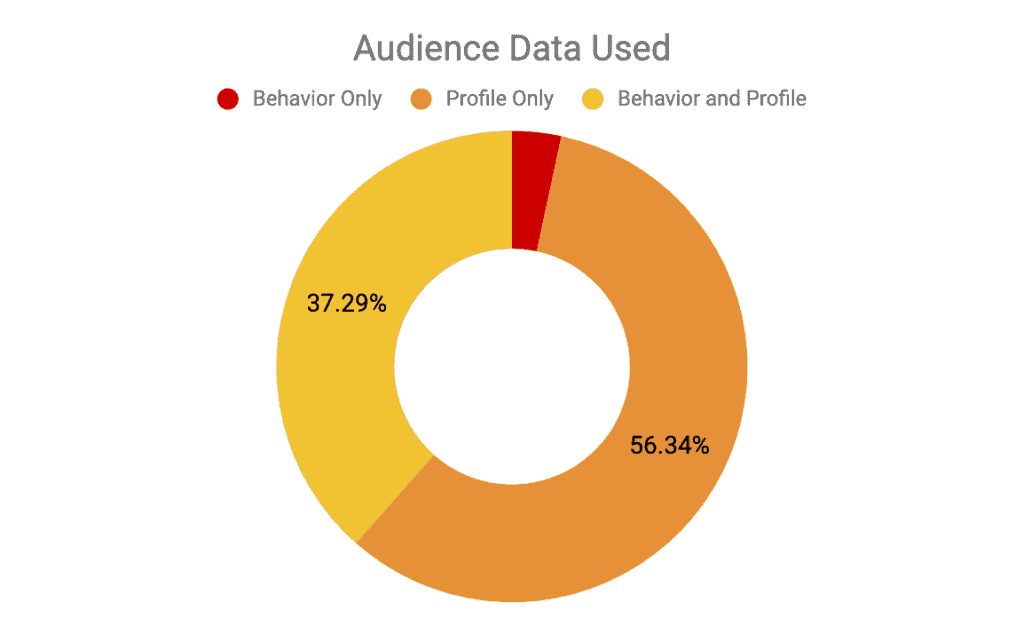
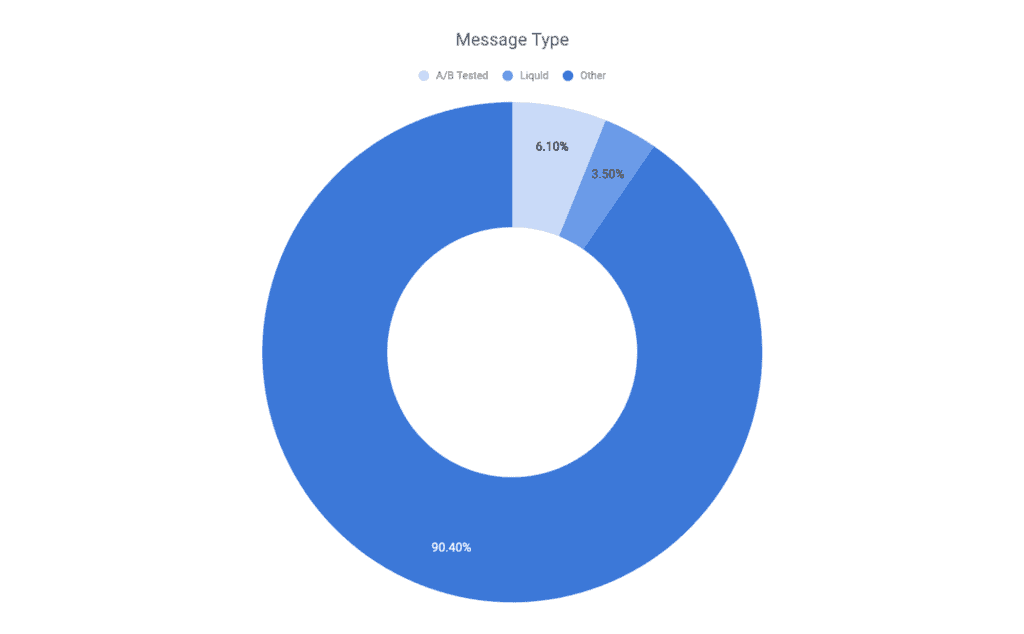
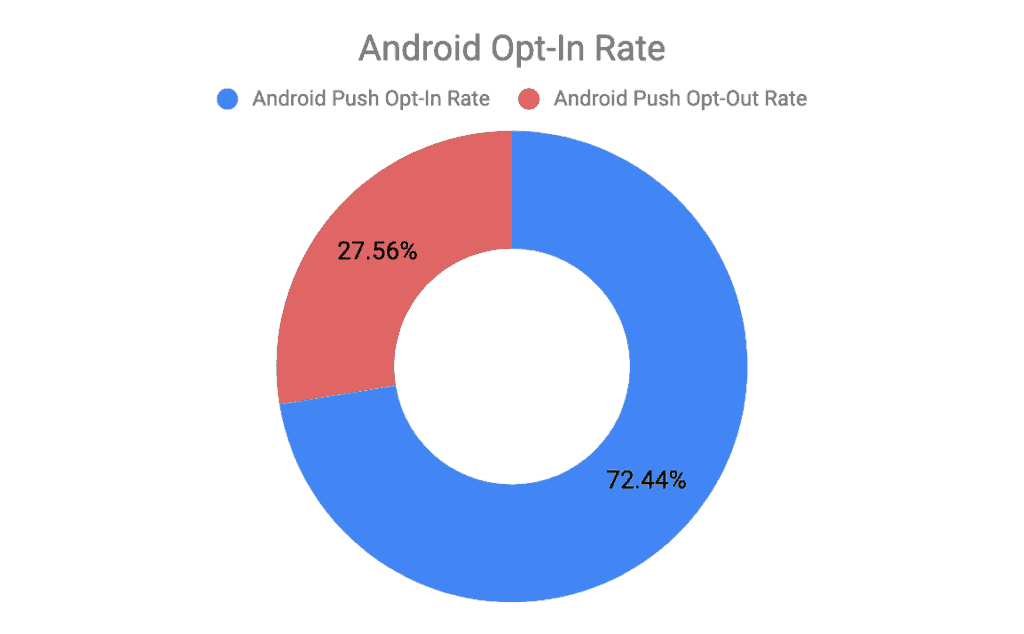
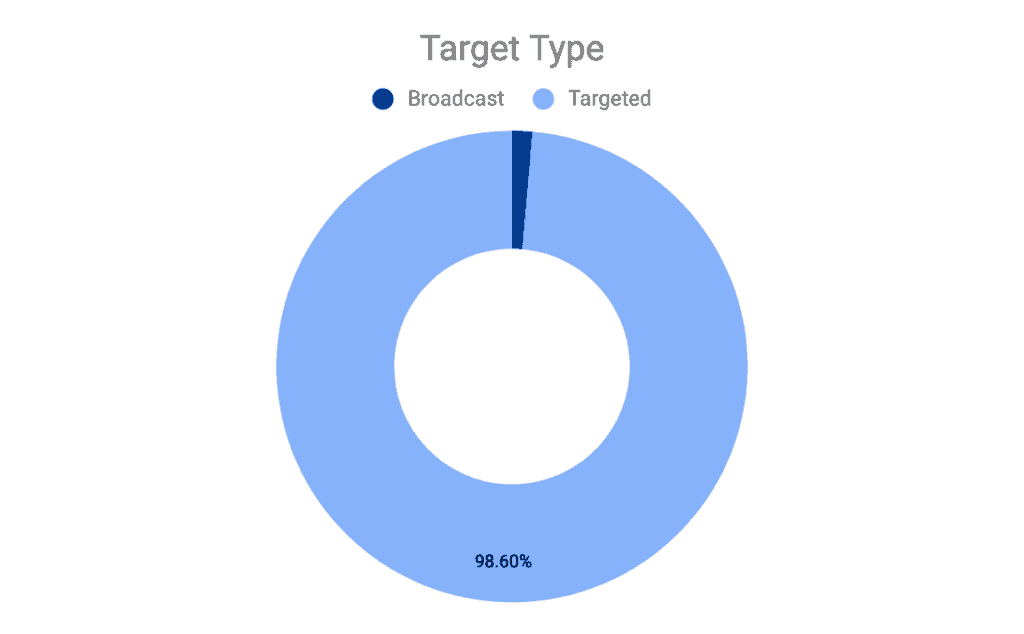
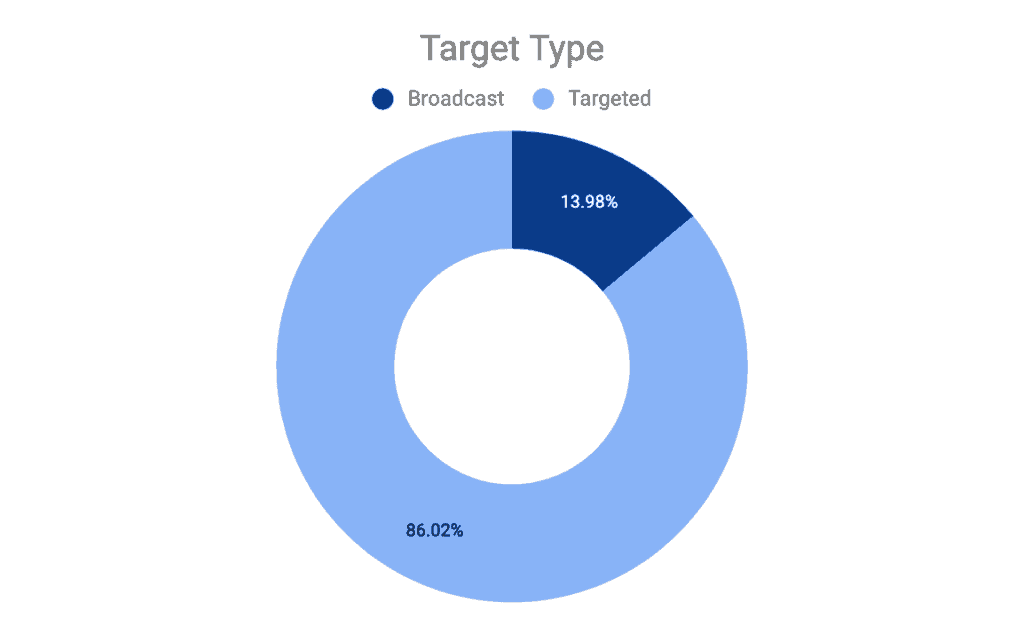
Personalization Stage
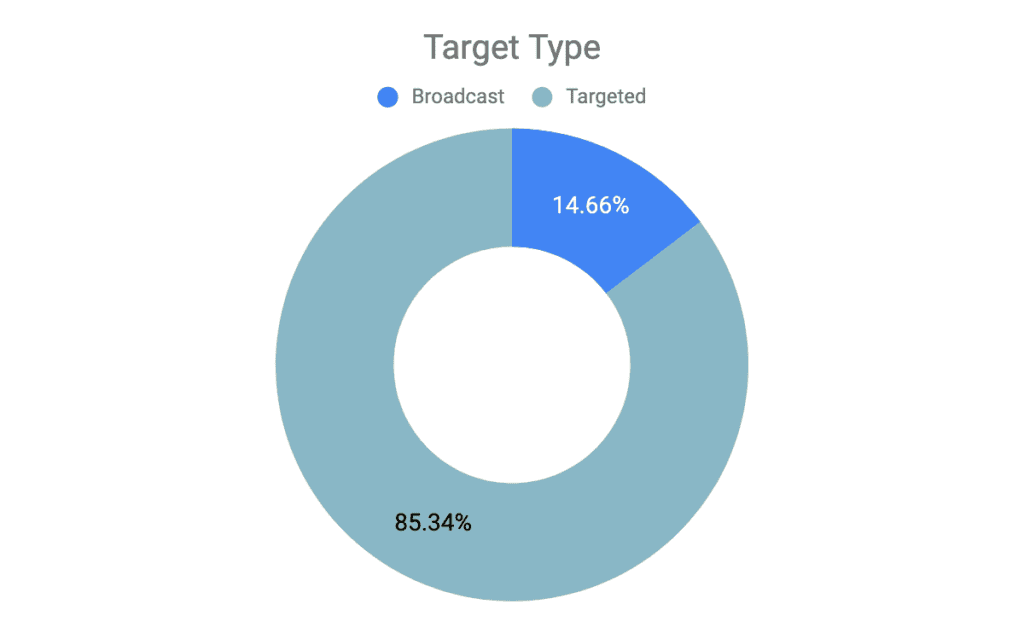
Based on our proprietary Stages of Personalization methodology, measuring all apps provide the average level of targeted messaging, data types used, and messaging types utilized. In sections further down, we place industries within a personalization stage based on high or low usage of each of these metrics. By comparing app personalization metrics against the average, brands can find which stage of personalization they exist within.
The four stages of personalization are:
- Stage 1, Novice — Sending primarily broadcast messages to all audiences
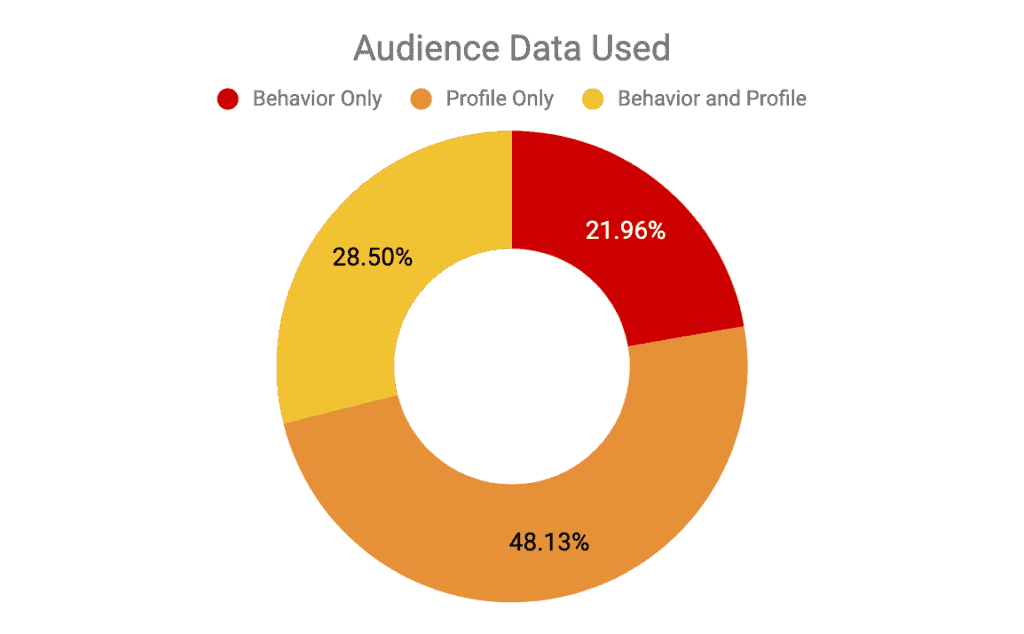
- Stage 2, Intermediate — Utilizing one type of personalization data, either profile or behavioral within your campaign sends
- Stage 3, Pro — Utilizing both types of personalization data, profile and behavioral in your campaign sends; or utilizing one type of data and dynamic content, which allows for customized content for each recipient
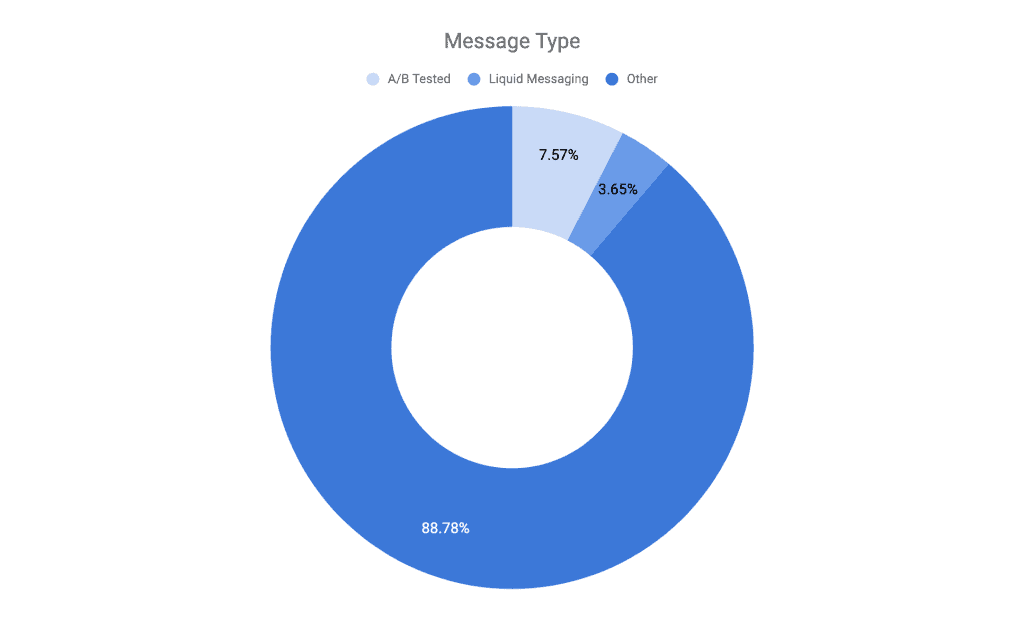
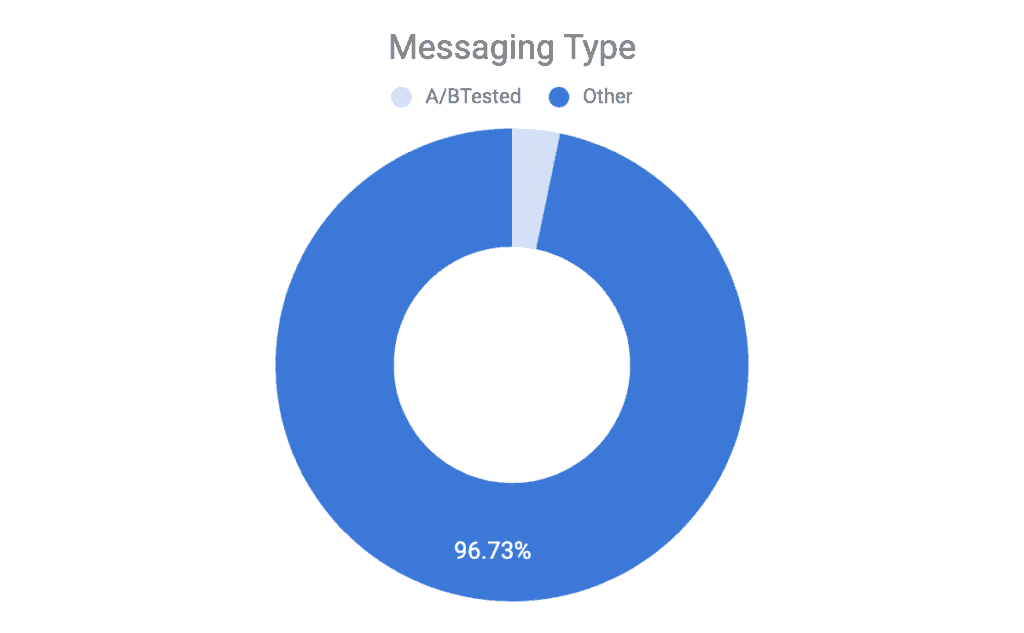
- Stage 4, Master — Full-fledged personalization; utilizing both types of data, dynamic content, and A/B testing
Do you have low broadcast message usage and utilize behavior and profile data while also using liquid messaging (a messaging template that allows brands to extract profile data and insert it into a personalized message)? If so, your brand is far ahead of the curve. But for most, they’ll reside somewhere a little less advanced. But personalization is a journey, not a test. Brands make their way through the stages, perfecting each additional piece of personalization as they add it. It’s an iterative process. By using the personalization approaches effectively, brands will be able to see the full benefits of personalization not only in their app metrics, but in their app revenue.
Compare your personalization efforts with the above numbers. For example, if your brand uses only profile data, but does not utilize dynamic (liquid) or A/B tested messaging, you would fall into the second stage of personalization, intermediate. Does your brand exceed or fall behind other apps? Find your industry’s personalization efforts below.
Now that you have learned the different metrics and benchmarks for your app, you should have a strong foundation of how your brand can improve to effectively drive ROI on your app. Then, dive into your industry’s benchmarks to see how your app compares to your industry peers instead of only overall apps.
Retail Industry Benchmarks
Monthly App Engagement
| App Launches | Session Length | Time in App |
| Average number of times an individual app is launched per month. |
Average time spent in an individual app across all sessions per month. |
Total amount of time spent in apps throughout the month. |
| 8.13 launches per month | 3 minutes, 16 seconds per session | 26 minutes, 30 seconds per month |
Retail apps experience fewer launches and less time per month than the average app. Users aren’t always looking to shop, so retail brands have to be extra-targeted with their messaging if they wish to succeed. Brands have less time and fewer opportunities to grab user attention, you have to send each engagement wisely or risk falling to the fray.
Weekly App Engagement
| App Launches | Session Length | Time in App |
| Average number of times an individual app is launched per week |
Average time spent in individual app across all sessions per week |
Total amount of time spent in apps throughout the week |
| 3.79 launches per week | 3 minutes, 15 seconds per session | 12 minutes, 19 seconds per week |

User Retention:
According to our data, 49.43% of users are retained one month after downloading the app, meaning 50.57% of users churned one month after download. Some good news for retail, users seem to be more loyal than the average app. While users are spending less time in retail apps, more of them are being retained.
Since 2015, the retail industry has trended to retain more customers; in 2015, 63% of users churned after one month and that number has been trending downward since. Retail brands are finding better ways to retain their users on their mobile platforms, as well as showcase that customers are becoming more comfortable with mobile apps as a form of retail shopping.
Marketing Metric Benchmarks
Android Users
| Push | In-App | |
| Open Rate | 4.47% | 15.94% |
| Conversion Rate | 1.31% | 2.45% |
| Engagement | 2.28 | 9.64 |
iOS Users
| Push | In-App | |
| Open Rate | 2.50% | 22.59% |
| Conversion Rate | 0.63% | 4.10% |
| Engagement | 1.86 | 8.94 |
Retail apps experience slightly lower than average message engagement rates, especially for iOS users, compared to the overall marketing metrics section above. Opt-in rates are average for iOS users, but Android users are more likely than average to opt-in to push notifications. Open rate, conversion rate, and engagements are slightly lower than normal. This could be due to a perceived monetary ask from retail apps, such as discount promotions or new items being promoted. It’s much easier to get someone to browse products or read a free article than to buy a pair of shoes. But homing in on the personalization strategy, as showcased in the next section, could get retail brands closer to average.
Retail Apps Personalization Stage: Intermediate
Based on our industry benchmarks, retail apps are close to entering Stage 3 in our stages of personalization, but for now remain in Stage 2. These apps have showcased that they have a slightly higher utilization of both profile and behavioral data together. However, more retail apps are using only profile data than the average app (vs profile plus behavioral data), which is one method retail brands could be more targeted with their messaging by combining profile with behavioral data. Retail apps have a relatively low use of broadcast messaging compared to other apps, a good sign that retail apps are embracing at least some personalization. Finally, retail apps are about average in terms of liquid and A/B tested messaging.
Consumer Financial Services
Monthly Engagement
| App Launches | Session Length | Time in App |
| Average number of times an individual app is launched per month. |
Average time spent in an individual app across all sessions per month. |
Total amount of time spent in apps throughout the month. |
| 23.1 launches per month | 2 minutes, 49 seconds per session | 64 minutes, 54 seconds per month |
Weekly Engagement:
| App Launches | Session Length | Time in App |
| Average number of times an individual app is launched per month. |
Average time spent in an individual app across all sessions per month. |
Total amount of time spent in apps throughout the month. |
| 10.2 launches per week | 2 minutes, 44 seconds per session | 27 minutes, 57 seconds per month |
It’s probably no surprise that consumer finance apps are engaged with more frequently than other apps. Consumer finance brands sit at the core of many users’ lives. Checking on finances, sending payments, managing portfolios are all integral functions that users need frequently. Each session lasts shorter but the aggregated time spent in the app is higher than average given the high volume of sessions.
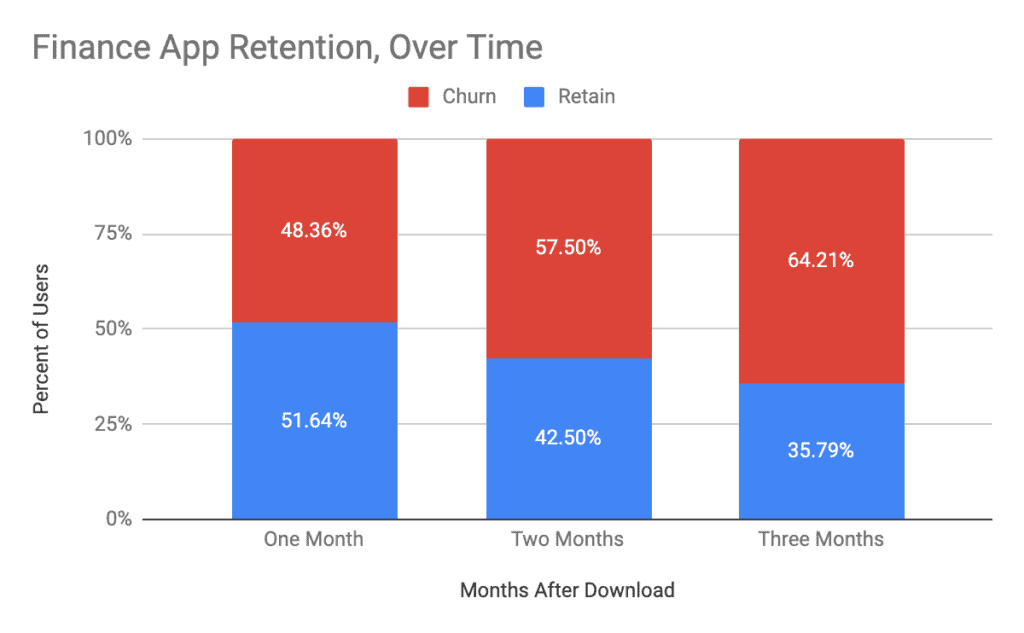
User Retention:
Finance apps experience much higher retention than the average app, compared to the overall app user retention section above. Consumers don’t move their money frequently, so brands must ensure that their app offers the valuable use cases that users need. App experience could be a make-or-break deal for many users given that so much of the financial world has now gone mobile.
Marketing Stats
Android Users
| Push | In-App | |
| Open Rate | 4.47% | 15.94% |
| Conversion Rate | 1.31% | 2.45% |
| Engagement | 2.28 | 9.64 |
iOS Users

| Push | In-App | |
| Open Rate | 3.24% | 26.24% |
| Conversion Rate | 0.41% | 1.50% |
| Engagement | 1.07 | 12.20 |
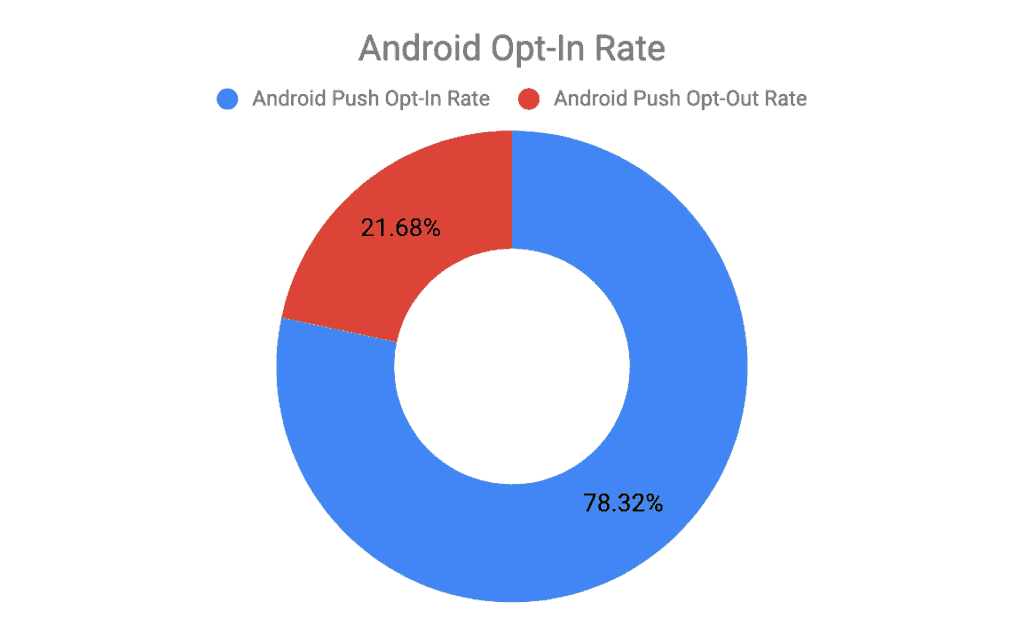
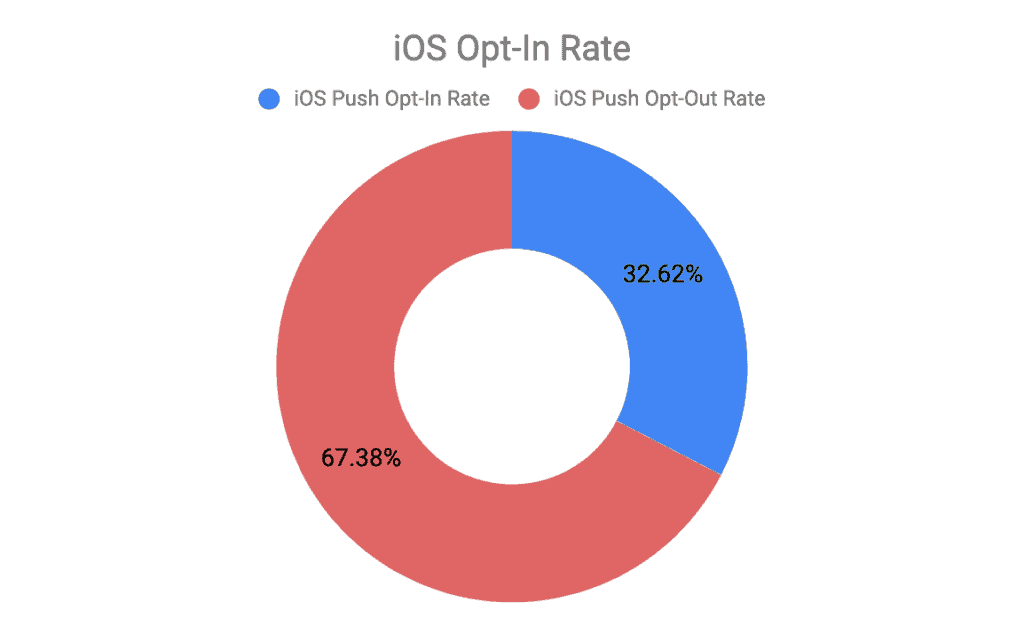
Compared to the overall app marketing metric section above, opt-in rates for Android users are fairly average but iOS users are much more likely to opt-in to their finance brand’s messages. Remember, Android defaults to opting in to app notifications whereas iOS does not, so this showcases that users are looking for messaging from these brands. Push notification marketing success holds at about average for both Android and iOS, but in Android, in-app engagements fall below average and iOS in-app engagements far exceed average.
Consumer Financial Apps Personalization Stage: Beginner
Based on our overall personalization benchmarks, consumer finance apps fall in the first stage of personalization, with signs that they may begin to enter the second stage. Finance apps send relatively few broadcast messages. Only about 2% of messages are broadcast, much better than average, but more of those are relying on only one type of data. Behavior and profile data combined are used less often than average and behavioral data is relied upon heavily compared to average. Financial brands have shown no evidence of liquid messaging in their campaigns and relatively few campaigns are A/B tested.
Media Apps
Monthly Engagement
| App Launches | Session Length | Time in App |
| Average number of times an individual app is launched per month. |
Average time spent in an individual app across all sessions per month. |
Total amount of time spent in apps throughout the month. |
| 14.9 launches per month | 7 minutes, 7 seconds per session | 106 minutes, 5 seconds per month |
Weekly Engagement
| App Launches | Session Length | Time in App |
| Average number of times an individual app is launched per month. |
Average time spent in an individual app across all sessions per month. |
Total amount of time spent in apps throughout the month. |
| 6.27 launches per week | 7 minutes, 7 seconds per session | 44 minutes, 35 seconds per month |
Media apps experience significantly more launches and time spent than the average app, compared to engagement rates from the overall app engagement rate section above. Again, this stands to reason, given that media content takes time to consume.
User Retention:
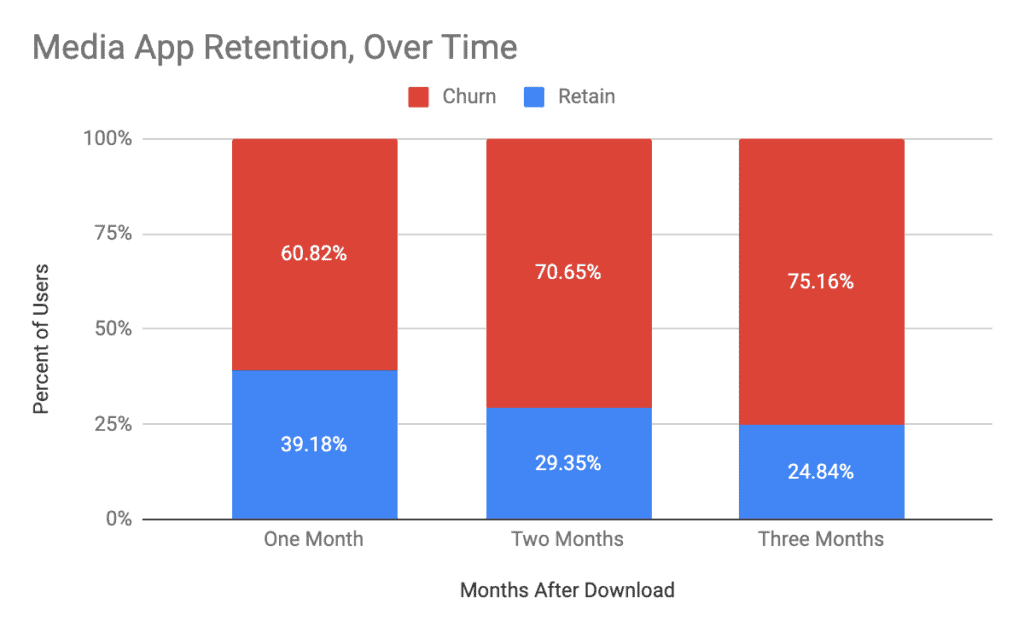
Compared to overall app user retention, media apps experience relatively average rates of user retention.
Marketing Stats
Android Users
| Push | In-App | |
| Open Rate | 2.87% | 6.29% |
| Conversion Rate | 1.74% | 4.10% |
| Engagement | 3.31 | 21.90 |
iOS Users
| Push | In-App | |
| Open Rate | 3.90% | 12.60% |
| Conversion Rate | 1.85% | 4.10% |
| Engagement | 3.14 | 7.99 |
Media apps experience relatively average marketing metrics, including opt-in rates, open rates, conversion rates, and engagements, compared to the overall benchmarks across industries in the app marketing metrics section above.
Media Apps Personalization Stage: Beginner

Compared to the overall app personalization stage averages above, media apps fall into the first stage of personalization, relatively low personalization. This can be supported by the idea that there is more of a focus on broadcast messages in the media industry, such as content updates and breaking news alerts. However, with the other messages, brands can engage with their users at higher rates. Media brands utilize only one type of data (profile or behavioral) more often than average. They are combined less often than other industries. Liquid messaging and A/B testing is also utilized less frequently than average. Media brands would be able to find more success with their marketing campaigns by personalizing the messages that don’t need to be broadcast.
Travel Apps
Monthly Engagement
| App Launches | Session Length | Time in App |
| Average number of times an individual app is launched per month. |
Average time spent in an individual app across all sessions per month. |
Total amount of time spent in apps throughout the month. |
| 11.7 launches per month | 2 minutes, 55 seconds per session | 30 minutes, 17 seconds per month |
Weekly Engagement
| App Launches | Session Length | Time in App |
| Average number of times an individual app is launched per month. |
Average time spent in an individual app across all sessions per month. |
Total amount of time spent in apps throughout the month. |
| 4.93 launches per week | 2 minutes, 55 seconds per session | 14 minutes, 31 seconds per month |
Compared to the overall app section above, travel apps experience an average number of launches per month/week. However, sessions last much shorter than the average, resulting in less time spent in the app. As a result, travel brands have less time to capture user attention, making each engagement more important.
User Retention
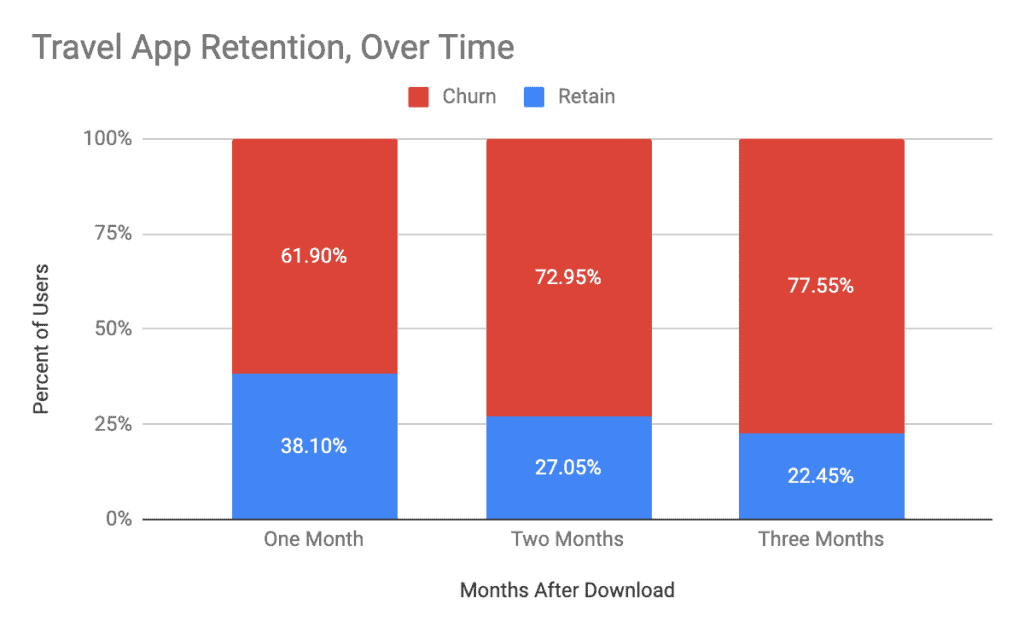
Travel apps experience slightly less user retention than the average app. Travel brands must make their experience as engaging as possible to drive conversions and retain customers, which could mean more personalization, better UX, or added functionality.
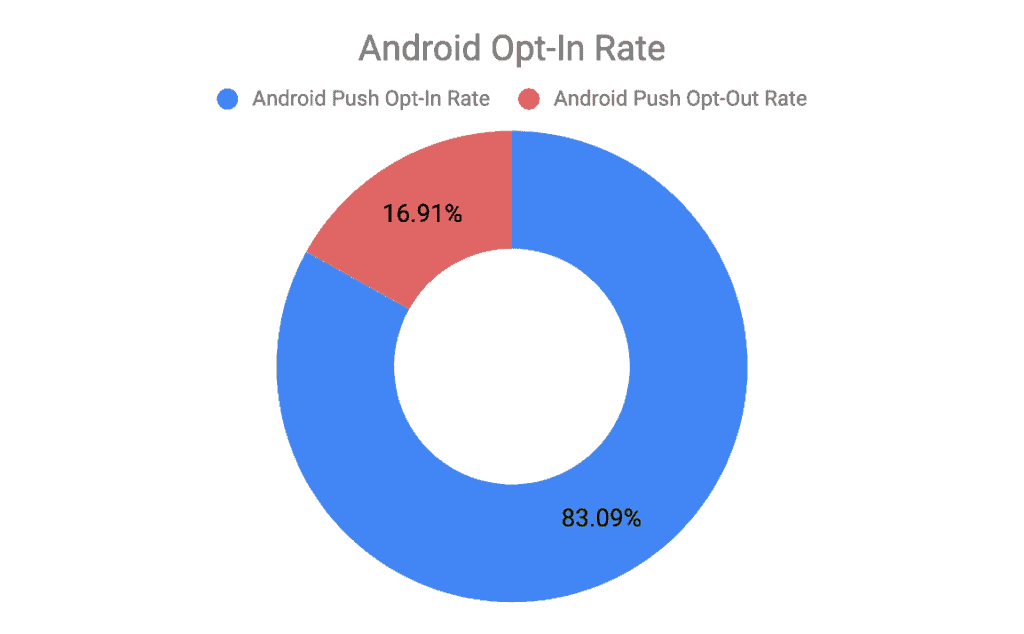
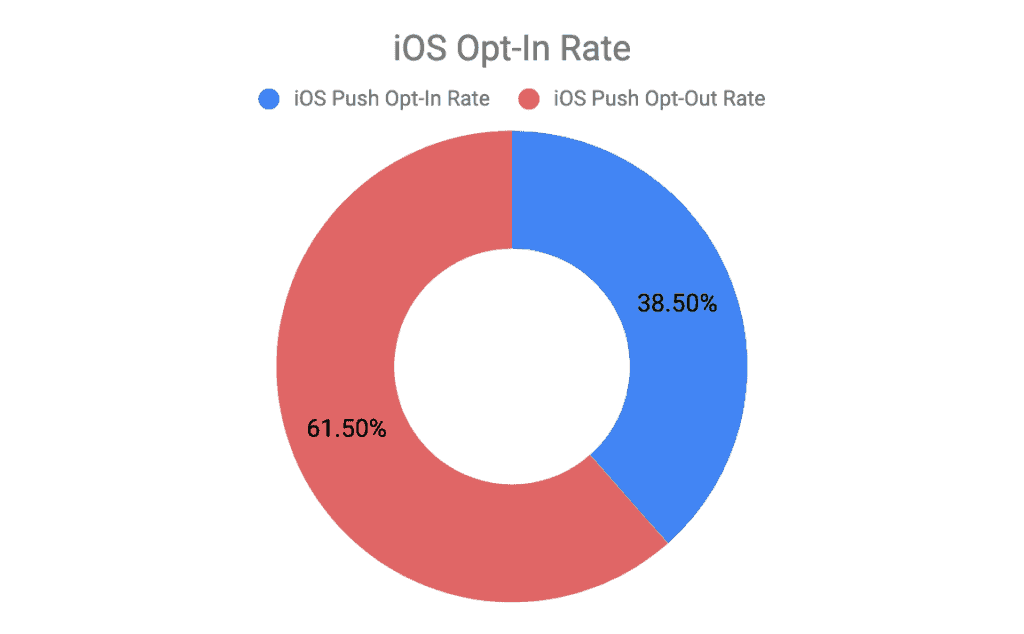
Marketing Stats
Android Users
| Push | In-App | |
| Open Rate | 7.03% | 13.82% |
| Conversion Rate | 0.29% | 1.60% |
| Engagement | 1.42 | 5.07 |
iOS Users
| Push | In-App | |
| Open Rate | 16.36% | 15.30% |
| Conversion Rate | 0.19% | 1.50% |
| Engagement | 1.34 | 5.21 |
Travel brands experience relatively average marketing metrics compared to the overall benchmarks across industries for monthly app engagement from the section above. One exception to that is users’ high push notification open rate for both iOS and Android. Travel brands are seemingly nailing it in terms of getting the users’ attention, however conversion rates are average so while brands may be able to get the user to open the app, they’re struggling to convert. This could be the often-high price barrier to travel leading to low conversion rates.
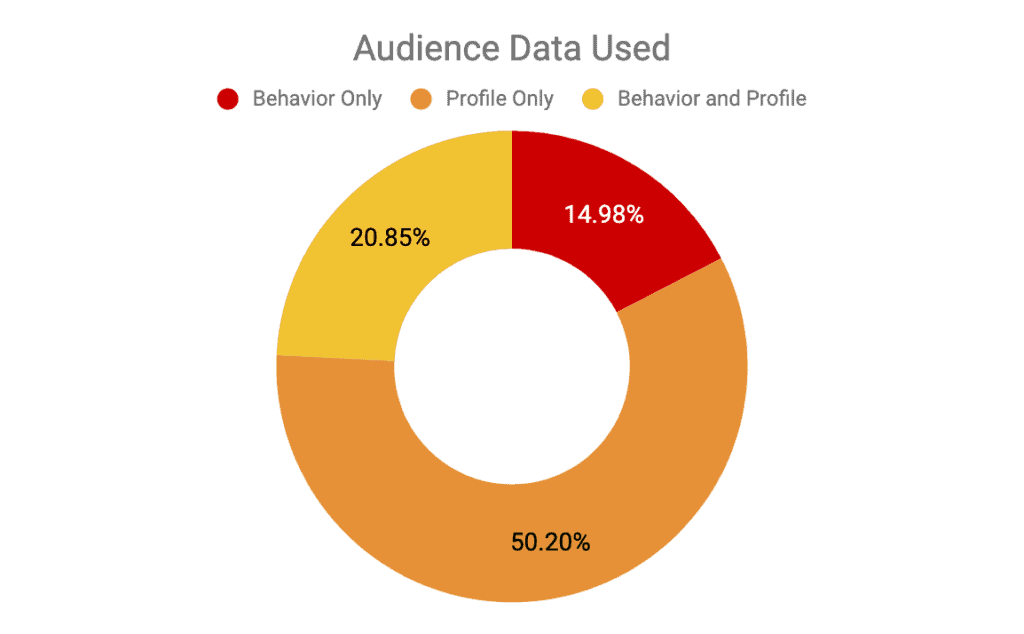
Travel Apps Personalization Stage: Pro
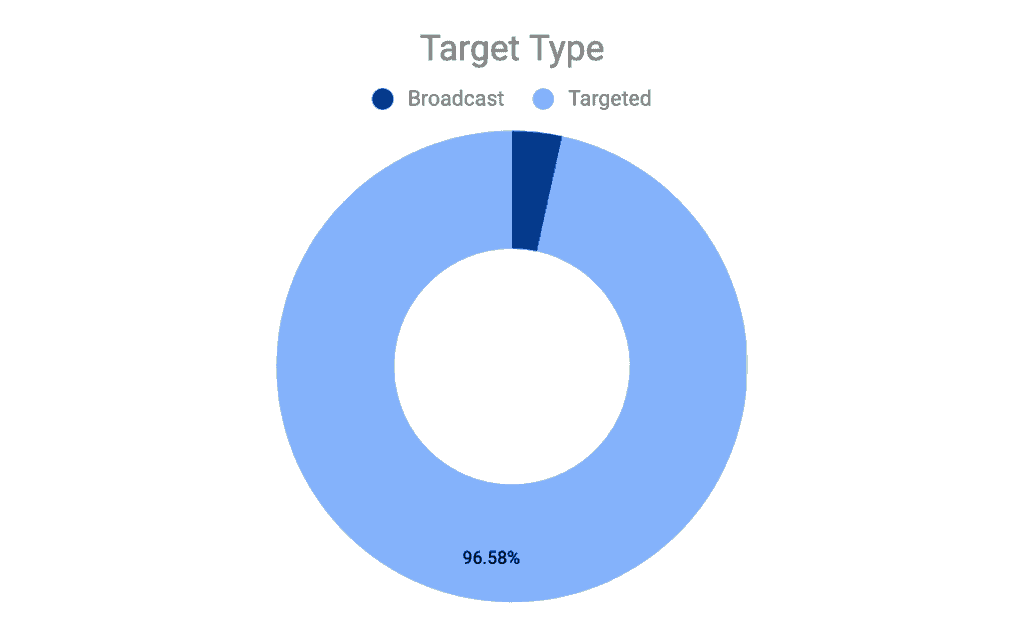
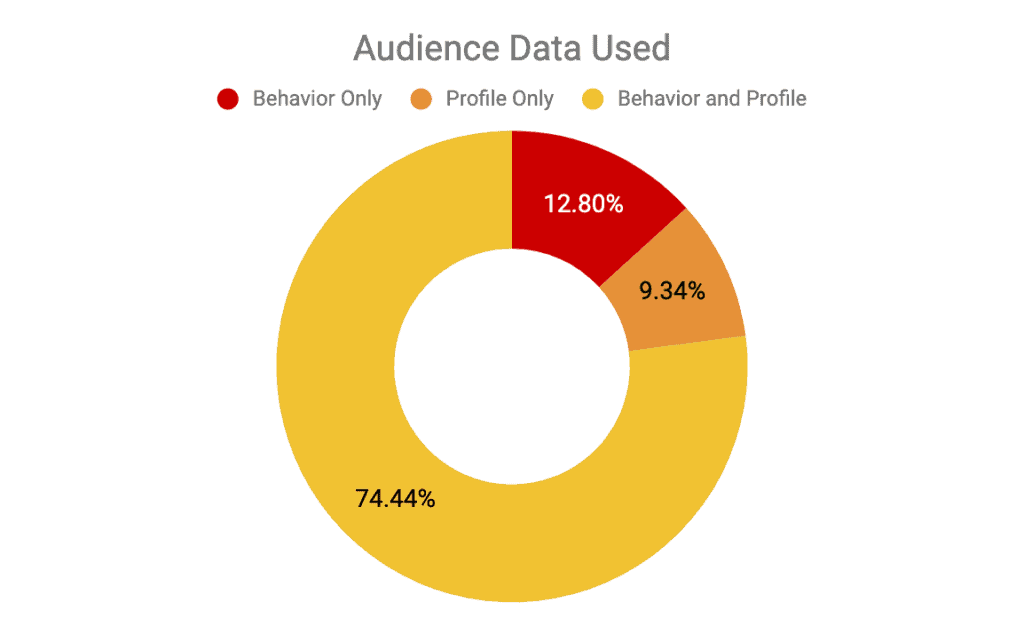
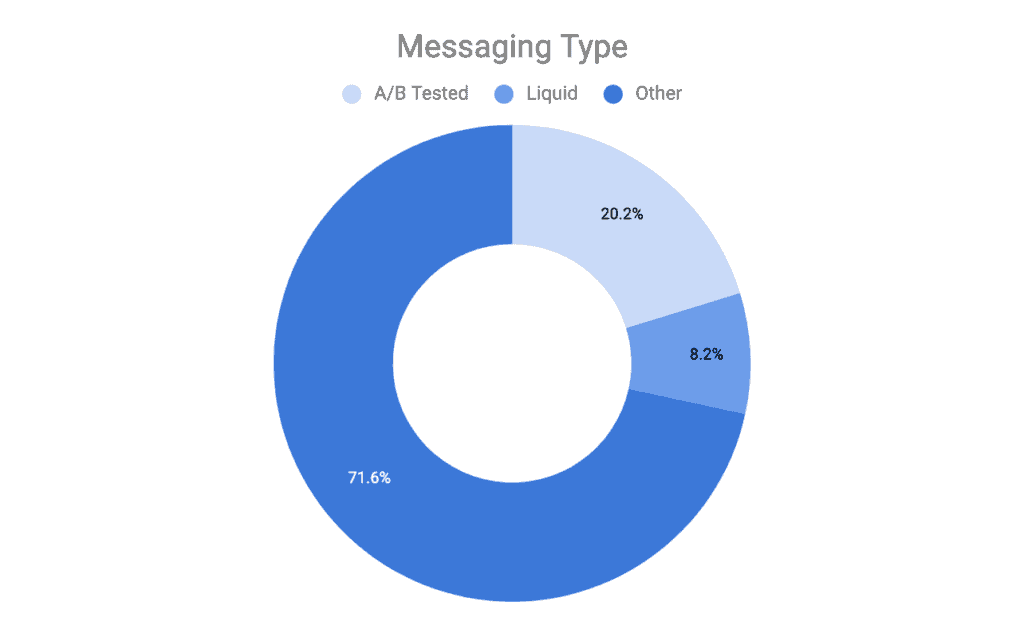
Travel brands are quickly becoming masters of personalization and are the leaders of the pack when it comes to personalization strategies across industries captured in these benchmarks. Nearly all travel app campaigns are targeted, showing very low broadcast messaging usage. Travel apps are also personalizing with their full arsenal of data available much more frequently than the average app, 75% of campaigns utilize both profile and behavior data, about 45% more than average. Travel apps are even getting great at messaging personalization, about 30% of messages are liquid or A/B tested, higher than average.
Conclusion
So how does your brand compare to the average app and within your industry? By comparing your mobile landscape to these benchmarks, your brand can find out where you are succeeding and where you can invest more into your app marketing strategy.
Contact us to learn more about how your brand can succeed with your app, increase your revenue, and create the best experience for your customers.