You’ve spent many marketing dollars with ad networks and ad tracking partners, running multiple campaigns targeting different user groups and demographics. Initially, you made a best-guess attempt at targeting the right people, but now, you’re faced with determining which campaign has given you the highest return on investment (ROI). Where do you begin?
You’re seeing downloads increase, but downloads don’t tell the full story of campaign ROI – after all, many apps are used only once. You need to know whether the users who download your app are ultimately spending their time and money there.
Localytics gives you real-time analytics that help you understand the success of your acquisition campaigns by attributing app usage, retention, conversion, and engagement back to each user acquisition campaign.
Measuring ROI Beyond the Download with Localytics
With Localytics, you can go beyond the download and look at user activity to determine which campaigns bring in people that choose to spend more time in your app and make more in-app purchases. This actionable data can impact your decisions on where to double down your acquisition spending efforts, as you optimize your campaigns.
There are three key Localytics reports that give you the insights you need to make intelligent campaign optimizations:
- Attribution gives you a high-level view of the number of users acquired, sessions per user, and average user lifetime value for each campaign and acquisition source
- Usage reports give you more granular insight into when and how often users from each acquisition source are spending time in your app
- Conversion events show you which of your acquisition sources and campaigns drive the most conversions and activities
Attribution: Track Campaign Performance
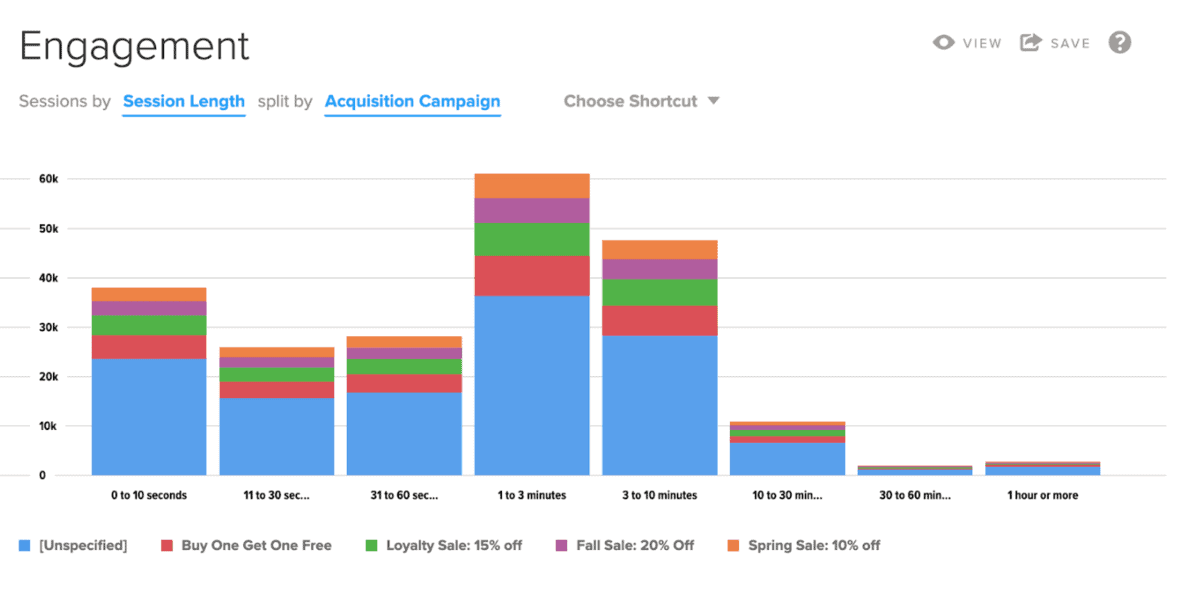
Localytics Attribution provides a high-level view of engagement and ROI from each user acquisition campaign. Use Attribution, to get the pulse of your campaign performance in terms of new users, sessions per user, and associated LTV per user. From here you can identify which campaigns are your strongest and weakest performers, then dive deeper into more granular reports to learn what differentiates these campaigns. To access the attribution report in the Analytics section, go to the Engagement dashboard and split the report by Marketing Source.

Usage: Learn Which Acquisition Source Delivers the Most Engaged Users
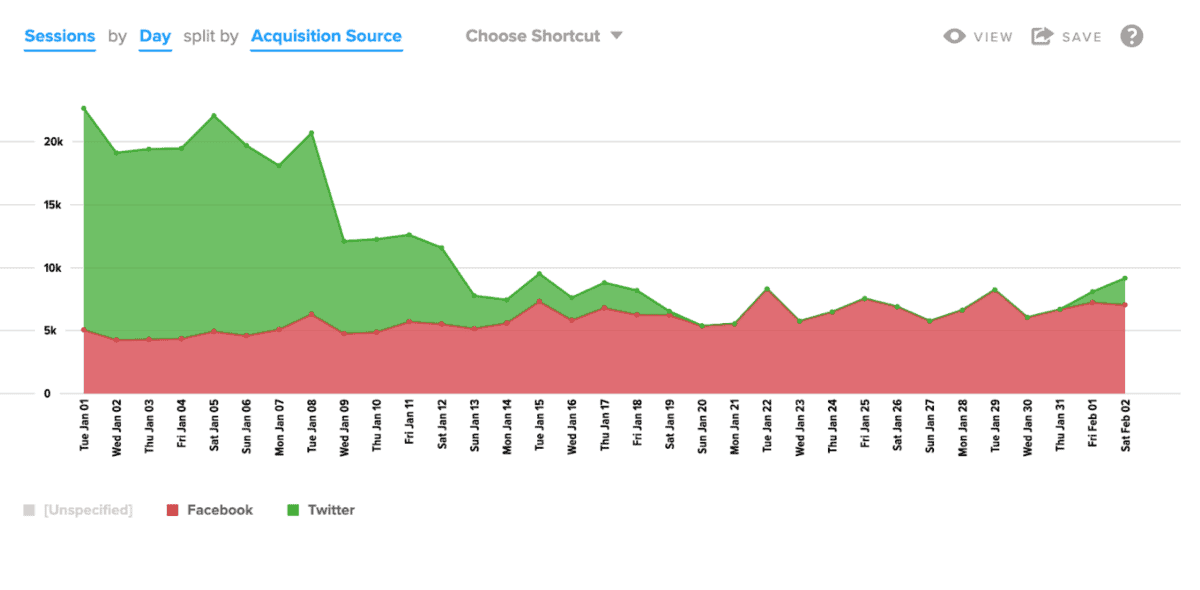
One way to identify your most engaged users is to track the sessions they have in your app. In the Localytics Usage report, you can track sessions and users over any time period. You can then split this report by “Acquisition Source” or “Acquisition Campaign” to compare which sources or campaigns are delivering the most active users over time.
Adjust the date range to get a close-up of the time period your campaign was running. Presented with this data, you can easily spot where your advertising budget should be going to provide you with the best returns.

Conversion Events: Determine which Acquisition Source Drives the Most Conversion Activity
In Localytics Events, you can track specific conversion activities, as well as other user activities in your app. You can split any event reports by acquisition source and campaign to understand which acquisition channel is bringing you the most active users, and the ones who convert most.
In the events report, we can examine in-app purchases across a time period, and split by “Acquisition Source” to determine which paid acquisition source the users originated from. We can also go a level deeper, and replace “Acquisition Source” with “Acquisition Campaign” to get detailed results on the performance of specific campaigns within an ad network.
Power Your Acquisition Strategy with Localytics Attribution
At Localytics, we integrate directly with all major ad networks (Facebook, Twitter, etc) and ad tracking partners (Kochava, Adjust, etc) giving you 85% coverage of the mobile advertising space. Use the Localytics analytics and marketing platform to track engagement and lifetime value of users from each of your acquisition campaigns and discover what’s working and what’s not.
